
Fig. 5
- ID
- ZDB-IMAGE-240206-30
- Publication
- Birdal et al., 2023 - Expression of taste sentinels, T1R, T2R, and PLCß2, on the passageway for olfactory signals in zebrafish
- All Figures
- Figures for Birdal et al., 2023
|
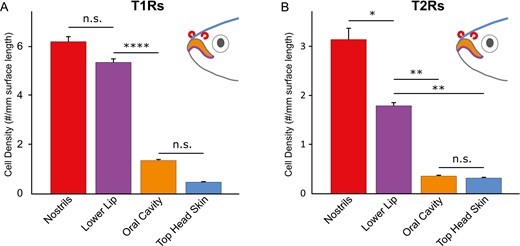
Fig. 5 Quantitative evaluation shows highest density of T1R- and T2R-expressing cells in nostrils, compared to known taste regions lower lip and oral cavity. T1R- and T2R-expressing cells were quantified in 4 different regions, lower lip, oral cavity, head skin, and nostrils. The fish head illustrations depict the analyzed organs and are color-coded in accordance with the bar graphs. Significance is evaluated by 1-way ANOVA followed by Tukey’s post-hoc HSD test and given by asterisks: *P < 0.05; **P < 0.01; ****P < 0.0001; error bars represent SEM. All pairwise comparisons not depicted possess p values below 0.0001. (A) T1R-expressing cell density in nostrils is high, similar to that in the lower lip, and both are much higher than densities observed in oral cavity and top head skin. (B) The density of the T2R-expressing cells in the nostrils is significantly higher than that of the lower lip, and both are much higher than the density of T2R-expressing cells in oral cavity and top head skin.