
Fig. 3
- ID
- ZDB-IMAGE-240206-28
- Publication
- Birdal et al., 2023 - Expression of taste sentinels, T1R, T2R, and PLCß2, on the passageway for olfactory signals in zebrafish
- All Figures
- Figures for Birdal et al., 2023
|
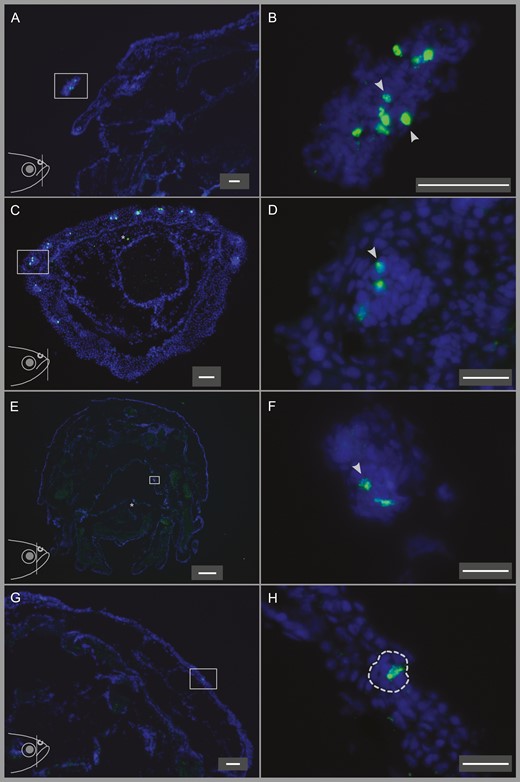
Fig. 3 In situ hybridization of T1Rs to the nostrils, lower lip, oral cavity, and top head skin showing the different abundances of T1R-expressing cells in these organs. Fish head illustrations at the lower left corners of panels (A), (C), (E), and (G) show the approximate position of the coronal sections depicted in the respective panels. (A) A quarter of a coronal head section including the nostril (enclosed in the rectangle). (B) Higher magnification image of the nostril in panel (A), showing the abundant and dense T1R-expressing cells in the nostril. (C) A coronal section of the lower lip, T1R-expressing cells can be observed in several different taste buds in the lower lip. (D) Higher magnification of the area enclosed by the rectangle in panel (C), showing the T1R-labeled cells in that taste bud. (E) A coronal section of the head including the oral cavity. (F) Higher magnification of the area enclosed by the rectangle in panel (E), showing the only T1R-expressing cells observed in the oral cavity on this section. (G) A quarter of a coronal head section showing the single T1R-labeled cell in the top head skin on this section. (H) Higher magnification of the area enclosed by the rectangle in panel (G). The corresponding taste bud is enclosed by a dashed line. Scale bars are 50 µm (A–C, G), 20 µm (D, F, H), and 200 µm (E).