
- Title
-
Transcriptomic comparison of two selective retinal cell ablation paradigms in zebrafish reveals shared and cell-specific regenerative responses
- Authors
- Emmerich, K., Walker, S.L., Wang, G., White, D.T., Ceisel, A., Wang, F., Teng, Y., Chunawala, Z., Graziano, G., Nimmagadda, S., Saxena, M.T., Qian, J., Mumm, J.S.
- Source
- Full text @ PLoS Genet.
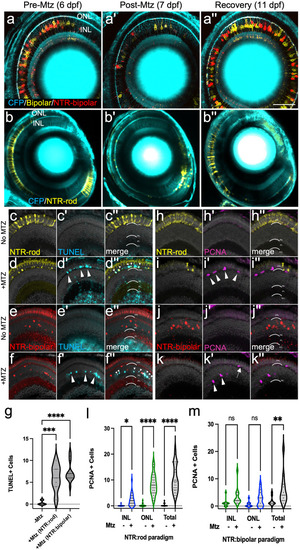
Two Nitroreductase (NTR) models enabling inducible retinal cell-type specific ablation. (a-b series) In vivo time-series imaging following the NTR-bipolar (a-a”) or NTR-rod (b-b”) response to metronidazole (Mtz) treatment to induce cell death and regeneration. Images were taken in the same fish at 6 dpf (before Mtz onset, a, b), 7 dpf (after treatment, a’, b’) and 11 dpf (following recovery, a”, b”). Larvae for each ablation paradigm express CFP derived from Tg(pax6-DF4:gap43-CFP)q01 to label general retinal structures. (c-f series) Representative histological staining for TUNEL (terminal deoxynucleotidyl transferase dUTP nick end labeling) at 7 dpf in uninjured NTR-rod larvae (c-c”) and Mtz treated NTR-rod larvae (d-d”) as well as in uninjured and Mtz-treated NTR-bipolar larvae (e-e”, f-f”, respectively). (g) Quantification of TUNEL+ cell counts at 7 dpf in untreated fish (-Mtz) or following the ablation of each cell type [+Mtz (NTR-rod) and +Mtz (NTR-bipolar)]. For the statistical analysis, Welch’s one-way ANOVA was followed by student’s t test with Dunnett’s method for multiple comparisons correction. (h-k series). Representative histological staining for PCNA (proliferative cell nuclear antigen) at 9 dpf in uninjured NTR-rod larvae (h-h”) and Mtz treated NTR-rod larvae (i-i”) as well as in uninjured (j-j”) and Mtz-treated NTR-bipolar larvae (k-k”). (l,m) Quantification of PCNA+ cell counts at 9 dpf in (l) untreated NTR-rod fish or following the ablation of rods (m) and in untreated NTR-bipolar fish or following the ablation of bipolar cells. For both paradigms, quantification is split into total number of proliferative cells and those in the INL or ONL. For statistical comparisons, Student’s t test was used to assess the indicated paired conditions. Asterisks indicate the following p-value ranges: * = p<0.05, ** = p<0.01, *** = p<0.001, and **** = p<0.0001, “ns” indicates p>0.05. |
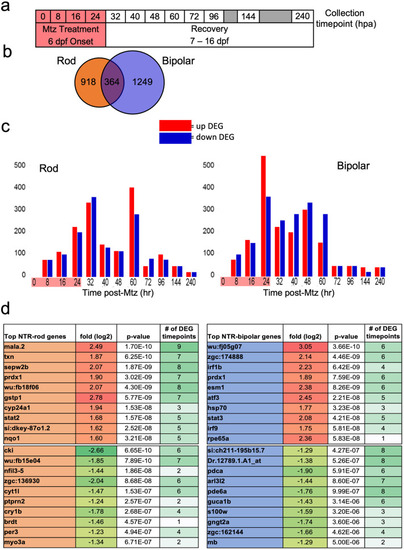
Microarray data collection, DEG identification and top hits. (a) Experimental design for tissue collection of whole eyes for microarray analysis. Treatment with Mtz for 24h was induced at 6 dpf following screening for NTR-rod+ or NTR-bipolar+ fish. Eyes were collected in triplicate at the following 12 timepoints including t0, t8, t16, 24, t32, t40, t48, t60, t72, t92, t144 and t240. (b) Venn diagram illustrating the total number of differentially expressed genes (DEGs) unique to either cell type or shared between the two at all timepoints. (c) Chart showing distribution of upregulated and downregulated DEGs in each paradigm. (d) Top 10 up and downregulated genes across the entire data set based on p-value as well as the number of timepoints that gene was identified as differentially expressed out of 12. |
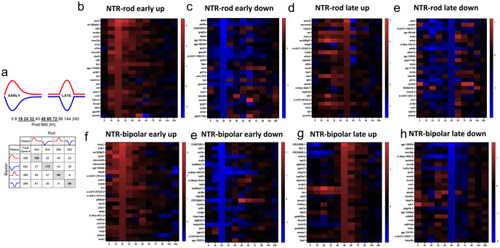
Identification of early and late DEG patterns and heatmaps for top DEGs in each. (a) DEGs for each paradigm were split into upregulated (red) and downregulated (blue) as well as early (16-32h) and late (48-72h) based on peaks in |
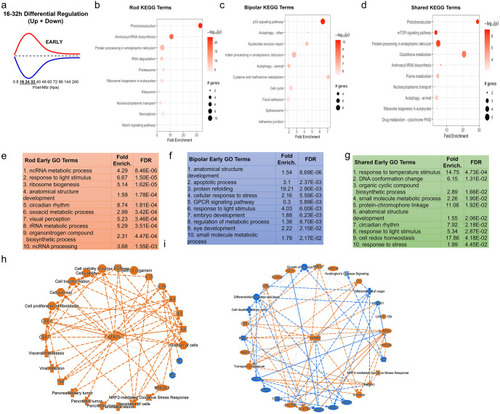
Pathway analysis of early DEG pattern in both paradigms. (a) Curve demonstrating expression pattern for early upregulated (red) and downregulated (blue) genes along our timepoints. (b-d) Top 10 enriched KEGG pathway terms including p-value and # of genes found as DEGs in the NTR-rod (b), NTR-bipolar (c) or from shared DEGs across both paradigms (d). (e-g) Top 10 enriched Gene Ontology pathway terms including fold enrichment and false discovery rate in the NTR-rod (e), NTR-bipolar (f) or from shared DEGs across both paradigms (g). (h-i) Unsupervised gene networks produced from ingenuity pathway analysis for DEGs in the NTR-rod (h) and NTR-bipolar (i) paradigm. Orange indicates upregulated gene/pathway term while blue indicates downregulated. |
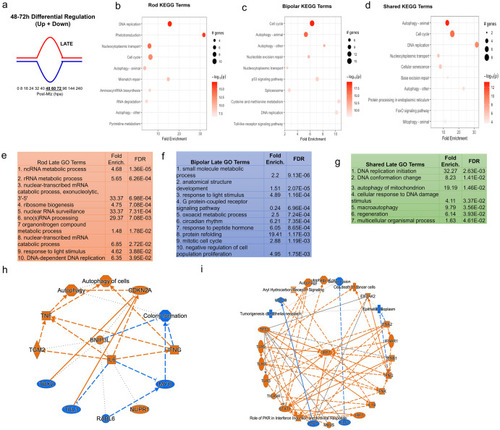
Pathway analysis of late DEG pattern in both paradigms. (a) Graphic demonstrating expression pattern for late upregulated (red) and downregulated (blue) genes along our timepoints. (b-d) Top 10 enriched KEGG pathway terms including p-value and # of genes found as DEGs in the NTR-rod (b), NTR-bipolar (c) or from shared DEGs across both paradigms (d). (e-g) Top 10 enriched Gene Ontology pathway terms including fold enrichment and false discovery rate in the NTR-rod (e), NTR-bipolar (f) or from shared DEGs across both paradigms (g, only 7 terms enriched in this group). (h-i) Unsupervised gene networks produced from ingenuity pathway analysis for DEGs in the NTR-rod (h) and NTR-bipolar (i) paradigm. Orange indicates upregulated gene/pathway term while blue indicates downregulated. |
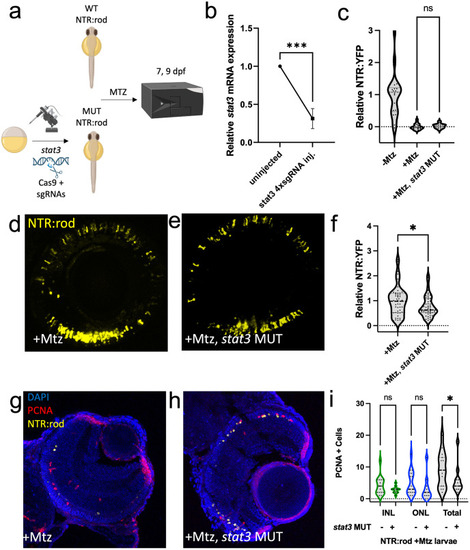
Stat3 is required for rod photoreceptor regeneration. (a) Experimental design depicting CRISPR/Cas9-based mutation (MUT) of |
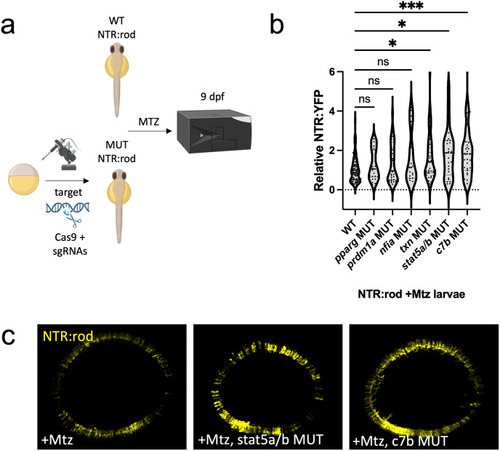
Rod cell regeneration is enhanced in (a) Experimental design depicting CRISPR/Cas9-based targeting of target genes via CRISPR/Cas9 in NTR-rod embryos. Control (+Mtz) and mutated NTR-rod larvae (+Mtz, |