
|
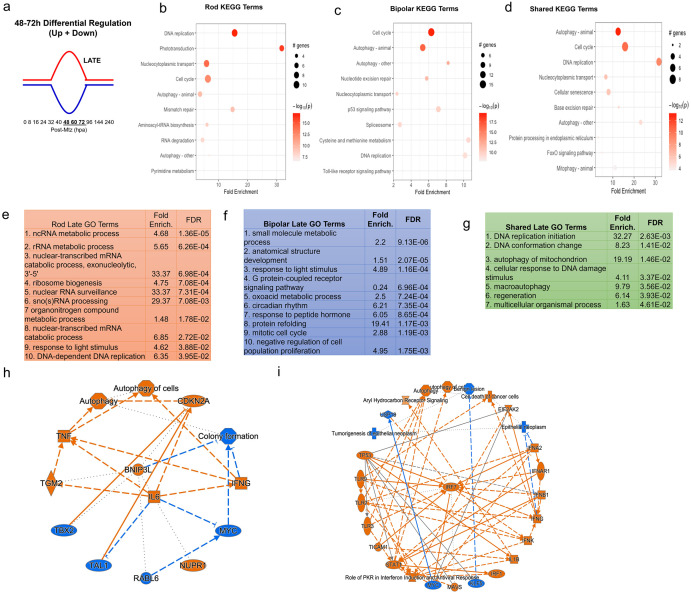
Fig 5 Pathway analysis of late DEG pattern in both paradigms.
(a) Graphic demonstrating expression pattern for late upregulated (red) and downregulated (blue) genes along our timepoints. (b-d) Top 10 enriched KEGG pathway terms including p-value and # of genes found as DEGs in the NTR-rod (b), NTR-bipolar (c) or from shared DEGs across both paradigms (d). (e-g) Top 10 enriched Gene Ontology pathway terms including fold enrichment and false discovery rate in the NTR-rod (e), NTR-bipolar (f) or from shared DEGs across both paradigms (g, only 7 terms enriched in this group). (h-i) Unsupervised gene networks produced from ingenuity pathway analysis for DEGs in the NTR-rod (h) and NTR-bipolar (i) paradigm. Orange indicates upregulated gene/pathway term while blue indicates downregulated.