FIGURE

Fig 3

ID
ZDB-FIG-231024-25
Publication
Emmerich et al., 2023 - Transcriptomic comparison of two selective retinal cell ablation paradigms in zebrafish reveals shared and cell-specific regenerative responses
Other Figures
All Figure Page
Back to All Figure Page
Fig 3

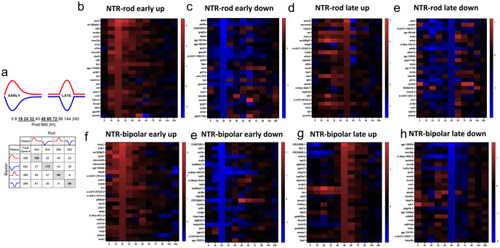
Identification of early and late DEG patterns and heatmaps for top DEGs in each.

(a) DEGs for each paradigm were split into upregulated (red) and downregulated (blue) as well as early (16-32h) and late (48-72h) based on peaks in Fig 2. The distribution of DEGs in these 8 patterns is shown in terms of unique and shared DEGs across both cell types. (b-h) The top 25 genes are plotted in heatmaps as a function of the largest fold changes at the middle timepoint in each pattern (24h and 60h) to demonstrate top genes defining each 8 patterns (NTR-rod and NTR-bipolar for patterns early-up, early-down, late-up and late-down).

Expression Data

Expression Detail
Antibody Labeling
Phenotype Data

Phenotype Detail
Acknowledgments
This image is the copyrighted work of the attributed author or publisher, and ZFIN has permission only to display this image to its users. Additional permissions should be obtained from the applicable author or publisher of the image. Full text @ PLoS Genet.