|
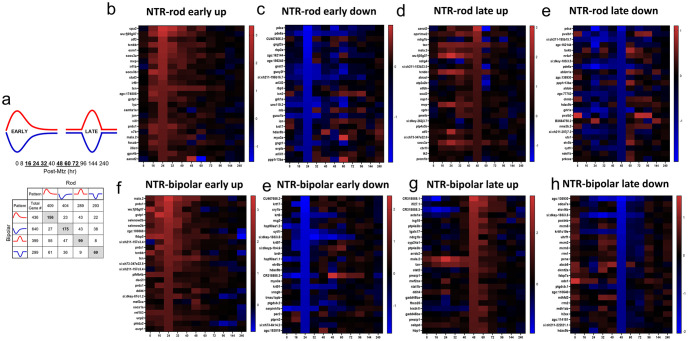
Fig 3 Identification of early and late DEG patterns and heatmaps for top DEGs in each.
(a) DEGs for each paradigm were split into upregulated (red) and downregulated (blue) as well as early (16-32h) and late (48-72h) based on peaks in

|
|
Fig 3 Identification of early and late DEG patterns and heatmaps for top DEGs in each.
(a) DEGs for each paradigm were split into upregulated (red) and downregulated (blue) as well as early (16-32h) and late (48-72h) based on peaks in