
Fig 4
- ID
- ZDB-FIG-231024-26
- Publication
- Emmerich et al., 2023 - Transcriptomic comparison of two selective retinal cell ablation paradigms in zebrafish reveals shared and cell-specific regenerative responses
- Other Figures
- All Figure Page
- Back to All Figure Page
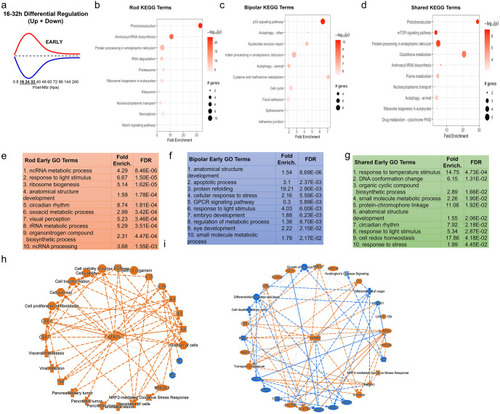
Pathway analysis of early DEG pattern in both paradigms. (a) Curve demonstrating expression pattern for early upregulated (red) and downregulated (blue) genes along our timepoints. (b-d) Top 10 enriched KEGG pathway terms including p-value and # of genes found as DEGs in the NTR-rod (b), NTR-bipolar (c) or from shared DEGs across both paradigms (d). (e-g) Top 10 enriched Gene Ontology pathway terms including fold enrichment and false discovery rate in the NTR-rod (e), NTR-bipolar (f) or from shared DEGs across both paradigms (g). (h-i) Unsupervised gene networks produced from ingenuity pathway analysis for DEGs in the NTR-rod (h) and NTR-bipolar (i) paradigm. Orange indicates upregulated gene/pathway term while blue indicates downregulated. |