FIGURE SUMMARY
Title

A comparative analysis of gene and protein expression in chronic and acute models of photoreceptor degeneration in adult zebrafish

Authors
Kramer, A.C., Carthage, J., Berry, Y., Gurdziel, K., Cook, T.A., Thummel, R.
Source
Full text @ Front Cell Dev Biol

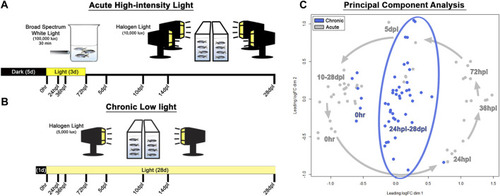
Methods and principal component analysis. (A) Experimental design used for acute phototoxic lesion, with tissue collection time-points along the bottom designated in hours/days post-light onset (hpl/dpl). (B) Chronic low light lesion model set-up demonstrating reduced intensity of the light lesion protocol with the same tissue collection time-points. The initial 100,000 lux step was removed, and the secondary stage was reduced in lux by 50% (compared with the AL model) and prolonged for 28 days. (C) Principal component analysis of the top 200 genes which maximized separation of the dark-adapted, 0 h baseline controls for both chronic low and acute light datasets. Acute light damage samples are displayed in grey, and chronic low light datasets are blue. The grey arrows represent the temporal progression trajectory of the tissue collection time-points. For the chronic low light samples, there was no clear temporal progression of the transcriptional landscape as there was in the acute light regeneration dataset, rather, tissue collection time-points post 0 h baseline were scattered in the middle of the plot.

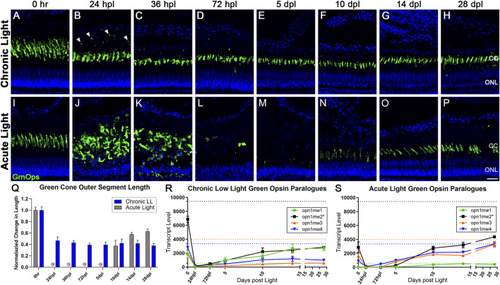
Differential morphology and opsin expression from cone photoreceptors in CLL and AL models. Green cone PRs were immunolabeled with anti-green opsin antisera (green) and nuclei were stained with TO-PRO-3 (blue). (A–H) Green opsin-positive cone PRs remained intact in response to the chronic light damage, but exhibited outer segment truncation over a 28-day CLL exposure. (B) At 24 hpl we observed a significant truncation of green cone PR outer segments (OS) as well as small puncta of immuno-positive debris in the outer retina. (C,D) At 36 and 72 hpl we observed a gradual reduction of the debris in the outer retina, but a continued truncation of green cone PR outer segments. (E–H) From 5–28 dpl green cone PRs remained intact, as evidenced by their cone cell nuclei and continued green opsin expression, but their outer segments remained truncated throughout the time-course. (I–P) Green cone PRs exhibited a classic degeneration and regeneration response to acute light damage. (J) At 24 hpl, cone OS were hypertrophied and ONL nuclei were pyknotic. (L) At 72 hpl, cone OS and their nuclei were completely absent. (N) Evidence of newly formed green cones was present by 10dpl. (Q) Green cone outer segment length quantified with ImageJ normalized to 0 h baseline in chronic vs. acute damage models (n = 5–7). For AL images, length was not calculated for 24 hpl-5 dpl as the cones were dying or dead. The OS length loss from the 0 h baseline was significant (p < 0.0001) starting at 24 hpl, and continuing for every consecutive time interval in the chronic low light samples. (R,S) Gene expression changes in all four paralogues of the green opsin gene (opn1mw1-4) displayed as transcript pseudocounts from 3′mRNA-seq of individual retinas for (R) CLL and (S) AL. Dotted lines represent baseline non-dark-adapted naïve control transcript levels. The asterisk in the key for opn1mw2 denotes the dominantly expressed paralogue at both the naïve and dark-adapted baselines in each model. (R) In CLL, the non-dominantly expressed green opsin paralogues opn1mw3/4 throughout the time-course, while the lowest expressed paralogue (green) recovers to the same exact level as the dominant opsin (black). (S) As time progresses during regeneration in the AL model, however, the dominantly expressed green opsin (black) exhibits a trend of recovery, along with two additional paralogues mw3/4 (orange and blue), while the lowest expressed opsin, mw1 remains low (green). (CC = green cone cell outer segment, ONL = outer nuclear layer; scale bar in panel P = 5 µm).

CLL exposure leads to slow rod photoreceptor degeneration, whereas rod photoreceptors are destroyed and replaced in the AL model. Rod PRs were immunolabeled (green) with zpr-3 to mark rod outer segments (ROS) and nuclei were stained blue with TO-PRO-3. (A–H) In response to chronic low light exposure, zpr-3 positive ROS displayed a gradual truncation over time until they were almost absent at 28dpl. (B) At 24 hpl, zpr-3 expression began to localize in the rod inner segments (RIS). (C) At 36 hpl, localization of zpr-3 expression was seen in both the RIS and outer nuclear layer (ONL). (E) By 5 dpl and onward, ROS were significantly truncated in length and zpr-3 expression was observed in the perinuclear area, along with a reduction in quantity of ONL nuclei. (I–P) Rod PR response to acute light damage. (J) At 24 hpl, ROS exhibited significant hypertrophy and ONL nuclei were pyknotic and disorganized. (M) At 5 dpl, the ROS debris field was cleared, and evidence of newly formed rods was observed at 10dpl (N). (Q) ROS length measured via ImageJ, normalized to 0 h baseline in chronic vs. acute damage models. Each time-point after 72 hpl in the CLL model shows a statistically significant decrease in ROS length as compared to the 0 h baseline (n = 5–6; p < 0.012–0.001). For AL images, length was not calculated for 24 hpl-5 dpl as the PRs were dying or dead. The final three time-points in the AL model were also statistically significant (p < 0.0001). (R) Percent change from 0 h in ImageJ-quantified zpr-3 mean fluorescence intensity (MFI) at each time-point. Each time-point 72 hpl and beyond in the CLL model represented a statistically significant MFI as compared to 0hpl in ROS (p < 0.003–0.0001). (S) Gene expression changes in rhodopsin in CLL vs. AL damage models displayed as transcript pseudocounts from 3′mRNA-seq of individual retinas. A steady decrease in rho gene expression was observed throughout the time-course in CLL retinas. (ROS = rod outer segments, RIS = rod inner segments, ONL = outer nuclear layer; scale bar in panel P = 5 µm).

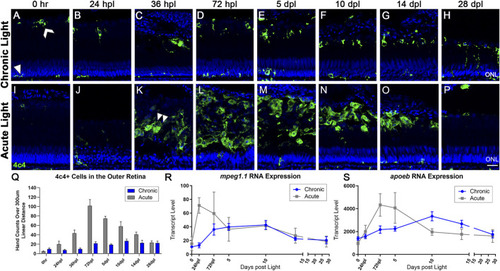
The microglial response to CLL is muted in comparison to AL damage. Anti-4c4 antisera (green) was used to immunolabel microglia and nuclei were stained with TO-PRO-3 (blue). (A) At rest, microglia exhibited two distinct morphologies. Within the ONL and plexiform layers, the microglia were ramified with thin projections (white arrowhead). In the outer retina, microglia resided at the outer margin of the ROS/RPE boundary in an activated state, exhibiting a slightly larger morphology with fewer projections (white chevron). (A–H) Over 28-day CLL exposure, we observed a slight increase in the microglia inflammatory response in the outer retina. (D) At 72 hpl, microglia accumulated at the tips of the truncated ROS (Figure 2). (H) At 28 dpl, we also observed some microglia interdigitating with ROS. (I–P) Microglia response in the AL damage model. (K) Microglial infiltration corresponded directly to peak PR damage in the AL model, with the first evidence of microglia with amoeboid morphology occurring at 36 hpl (double arrowhead). (M) The peak of microglial presence in the outer retina occurred at 72 hpl, corresponding to the completion of the debris clearance of cones, and significant consolidation of the ROS debris field. (Q) 4c4+ cell hand counts in the outer retina (not including ONL) over a 300 µm linear distance. In the CLL model, the only time-point with significantly higher 4c4+ cells in the outer retina as compared to 0 h is at 10 dpl (p < 0.011). In the AL model, there was a significant increase in 4c4+ cells for all time-points from 36 hpl–14 dpl (p < 0.041-p<0.001). (R,S) Gene expression changes in two microglia-associated genes (mpeg1.1 and apoeb) in CLL vs. AL damage models displayed as transcript pseudocounts from 3′mRNA-seq of individual retinas. In the AL model, we observed an early acute increase in these genes in a peak from 24 hpl to 5 dpl that preceded the observed increase in immunolabeled microglia. In the CLL model, the pattern of gene expression followed a similar pattern, only the peak occurred later, at 10 dpl and the wave was longer in duration. (ONL = outer nuclear layer; scale bar in panel P = 5 µm).

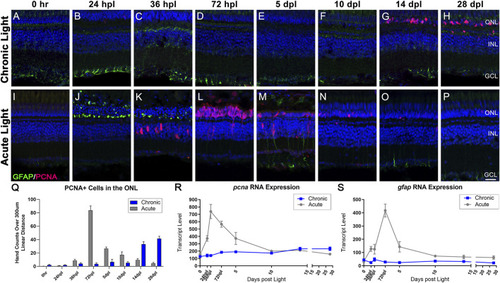
Distinct responses in Müller glia gliosis and proliferation in the CLL and AL models. Müller glia (MG) intermediate filaments were immunolabelled with anti-GFAP antisera (GFAP; green) and cell cycle re-entry was demonstrated with anti-PCNA antisera (PCNA; red). Nuclei were stained with TO-PRO-3 (blue). (A–H) The CLL model revealed minimal evidence of MG gliosis, localized to the inner retinal end feet. PCNA+ cells were minimal until 14 dpl, which demonstrated a significant increase in PCNA+ cells in the ONL that increased through 28 dpl. (I–P) Classic MG-mediated retinal regeneration in response to AL damage revealed an early increase in GFAP intensity in the ONL MG end feet at 24 hpl, and a second GFAP peak at 5 dpl. PCNA + cells resulting from MG division appeared in the INL at 36 hpl, which was followed by peak MGPC proliferation in the ONL at 72 hpl (Q) PCNA-positive nuclei quantified by hand-count over a 300 µm linear distance demonstrated the robust stem cell proliferation in the AL model (72 hpl-5 dpl; p < 0.0001), and late accumulation of PCNA + cells in the CLL model (14–28 dpl p < 0.0001). (R,S) Gene expression changes in pcna and gfap in CLL vs. AL damage models displayed as transcript pseudocounts from 3′mRNA-seq of individual retinas. (R) The transcriptional response of pcna followed the histological observations, with a strong peak in the AL model at 72 hpl vs. a slow mild increase in expression in the CLL model. (S) The gfap expression profile highlighted the robust gliotic response in the AL model in contrast with the absence of a significant response in the ALL model. (ONL = outer nuclear layer, INL = inner nuclear layer, GCL = ganglion cell layer; scale bar in panel P = 5 µm).

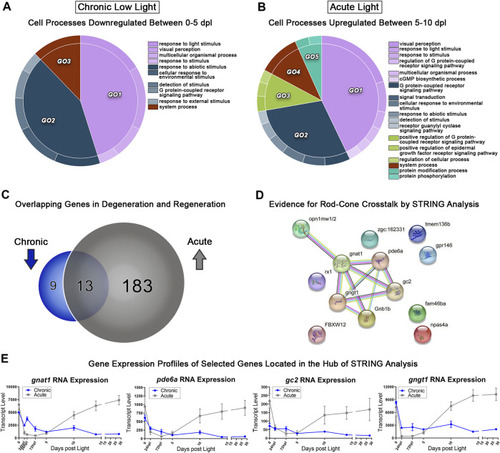
Comparative transcriptomic analysis of photoreceptor degeneration and regeneration. (A) Gene ontology (GO) analysis was performed on all downregulated differentially expressed genes (DEGs) in the 0–5 dpl CLL analysis with a fold change ≥2 (FDR<0.05). Redundant terms were consolidated using REVIGO, and visualized using the CirGO visualization software. (B) The same GO analysis and visualization was performed for all upregulated genes in the 5–10 dpl window of PR differentiation in the AL model with a fold change ≥2 (FDR<0.05). (C) Visual representation of the gene targets identified by the input cut-offs described above, with 22 genes downregulated in the CLL group, 196 upregulated in the AL group, and 13 genes duplicated in both groups, representing inverse transcriptional landscapes during degeneration and regeneration processes. (D) The 13 overlapping genes were input into the STRING platform to probe for known genetic interactions, revealing several rod-associated genes interacting with cone opsins during these two processes. (E) Transcript pseudocounts for 4 selected genes related to visual function were plotted for the entire 28dpl time-course (chronic low light in blue, acute light in grey).

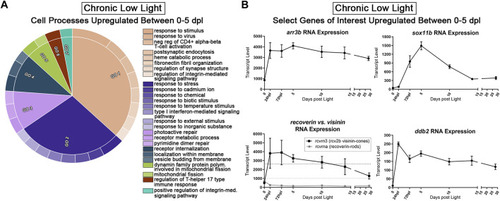
Transcriptomic analysis of early PR degeneration in the CLL Model. (A,B) Pairwise comparisons were performed on the 3′mRNA-seq datasets for 0 h and 5 dpl CLL model, representing a window of PR degeneration. (A) Gene ontology (GO) analysis was performed on all upregulated differentially expressed genes (DEGs) with a fold change ≥2 (FDR<0.05). Redundant terms were consolidated using REVIGO, and visualized using the CirGO visualization software. Common GO themes identified represent visual system, cell signaling, and immune system processes. (B) Select 3′mRNA-seq pseudocount graphs for genes that represent putative PR survival mechanisms.

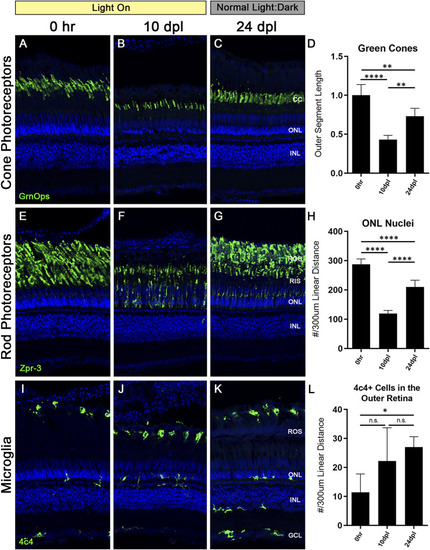
Truncated photoreceptor outer segments recover when zebrafish are transferred back to normal light:dark conditions. Zebrafish were subjected to the CLL lesion protocol for 10 days, then returned to normal light:dark housing conditions and allowed to recover for 14 days. After the 14-day recovery period, retinas were harvested at 24 days post initial light (dpl). (A–C) Retinal sections were immunolabelled with anti-Green Opsin (green) labelling green cone PRs. Significant truncation of cone outer segments (OS) was observed at 10 dpl, and following the 14-day recovery, cone OS length was partially restored. (D) Green cone OS length was quantified using ImageJ (n = 5–6). At 10 dpl of CLL exposure, OS length was reduced by >50% (p < 0.0001). Partial recovery of OS length was achieved to ∼75% of baseline levels (p < 0.002). (E–G) Rod PRs were immunolabelled with zpr-3 marking rhodopsin (green). (F) At 10dpl, we observed significant truncation of the ROS and internalization of the zpr-3 signal. (G) Following the 14-day recovery under normal light conditions, ROS presented morphological recovery and OS length was partially restored. (H) ONL nuclei were quantified by hand count over a 300 µm linear distance. Following significant loss of ONL nuclei at 10dpl (p < 0.0001), after retinas recovered for 14 days, ONL nuclei counts were restored up to ∼75% of the 0 h baseline (p < 0.0001). (I–K) Microglia in retinal sections were labeled with a 4c4+ antibody (green). 4c4+ cells clearly reside at the outer margin of the ROS at every stage of the protocol. (L) Hand count of 4c4+ cells present in the outer retina PR-layer over a 300 µm linear distance reveals an increase in microglia after the onset of the light exposure, despite removal of the light stimulus (p < 0.01 at 28 dpl). (CC = green cone cell outer segments, ONL = outer nuclear layer, INL = inner nuclear layer, ROS = rod outer segments, RIS = rod inner segments, GCL = ganglion cell layer).

Acknowledgments
This image is the copyrighted work of the attributed author or publisher, and ZFIN has permission only to display this image to its users. Additional permissions should be obtained from the applicable author or publisher of the image. Full text @ Front Cell Dev Biol