FIGURE

FIGURE 6

ID
ZDB-FIG-231002-407
Publication
Kramer et al., 2023 - A comparative analysis of gene and protein expression in chronic and acute models of photoreceptor degeneration in adult zebrafish
Other Figures
All Figure Page
Back to All Figure Page
FIGURE 6

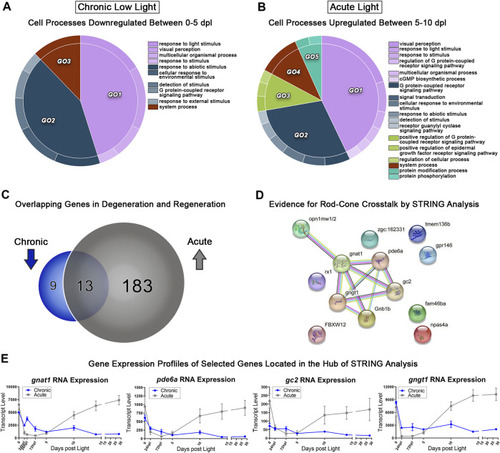
Comparative transcriptomic analysis of photoreceptor degeneration and regeneration. (A) Gene ontology (GO) analysis was performed on all downregulated differentially expressed genes (DEGs) in the 0–5 dpl CLL analysis with a fold change ≥2 (FDR<0.05). Redundant terms were consolidated using REVIGO, and visualized using the CirGO visualization software. (B) The same GO analysis and visualization was performed for all upregulated genes in the 5–10 dpl window of PR differentiation in the AL model with a fold change ≥2 (FDR<0.05). (C) Visual representation of the gene targets identified by the input cut-offs described above, with 22 genes downregulated in the CLL group, 196 upregulated in the AL group, and 13 genes duplicated in both groups, representing inverse transcriptional landscapes during degeneration and regeneration processes. (D) The 13 overlapping genes were input into the STRING platform to probe for known genetic interactions, revealing several rod-associated genes interacting with cone opsins during these two processes. (E) Transcript pseudocounts for 4 selected genes related to visual function were plotted for the entire 28dpl time-course (chronic low light in blue, acute light in grey).

Expression Data

Expression Detail
Antibody Labeling
Phenotype Data

Phenotype Detail
Acknowledgments
This image is the copyrighted work of the attributed author or publisher, and ZFIN has permission only to display this image to its users. Additional permissions should be obtained from the applicable author or publisher of the image. Full text @ Front Cell Dev Biol