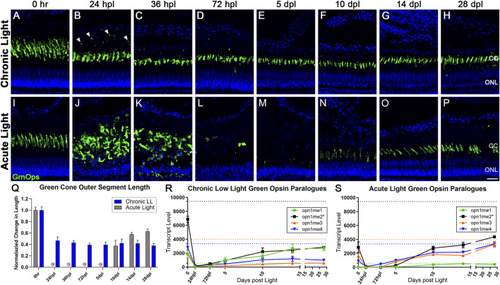
Differential morphology and opsin expression from cone photoreceptors in CLL and AL models. Green cone PRs were immunolabeled with anti-green opsin antisera (green) and nuclei were stained with TO-PRO-3 (blue). (A–H) Green opsin-positive cone PRs remained intact in response to the chronic light damage, but exhibited outer segment truncation over a 28-day CLL exposure. (B) At 24 hpl we observed a significant truncation of green cone PR outer segments (OS) as well as small puncta of immuno-positive debris in the outer retina. (C,D) At 36 and 72 hpl we observed a gradual reduction of the debris in the outer retina, but a continued truncation of green cone PR outer segments. (E–H) From 5–28 dpl green cone PRs remained intact, as evidenced by their cone cell nuclei and continued green opsin expression, but their outer segments remained truncated throughout the time-course. (I–P) Green cone PRs exhibited a classic degeneration and regeneration response to acute light damage. (J) At 24 hpl, cone OS were hypertrophied and ONL nuclei were pyknotic. (L) At 72 hpl, cone OS and their nuclei were completely absent. (N) Evidence of newly formed green cones was present by 10dpl. (Q) Green cone outer segment length quantified with ImageJ normalized to 0 h baseline in chronic vs. acute damage models (n = 5–7). For AL images, length was not calculated for 24 hpl-5 dpl as the cones were dying or dead. The OS length loss from the 0 h baseline was significant (p < 0.0001) starting at 24 hpl, and continuing for every consecutive time interval in the chronic low light samples. (R,S) Gene expression changes in all four paralogues of the green opsin gene (opn1mw1-4) displayed as transcript pseudocounts from 3′mRNA-seq of individual retinas for (R) CLL and (S) AL. Dotted lines represent baseline non-dark-adapted naïve control transcript levels. The asterisk in the key for opn1mw2 denotes the dominantly expressed paralogue at both the naïve and dark-adapted baselines in each model. (R) In CLL, the non-dominantly expressed green opsin paralogues opn1mw3/4 throughout the time-course, while the lowest expressed paralogue (green) recovers to the same exact level as the dominant opsin (black). (S) As time progresses during regeneration in the AL model, however, the dominantly expressed green opsin (black) exhibits a trend of recovery, along with two additional paralogues mw3/4 (orange and blue), while the lowest expressed opsin, mw1 remains low (green). (CC = green cone cell outer segment, ONL = outer nuclear layer; scale bar in panel P = 5 µm).
|
