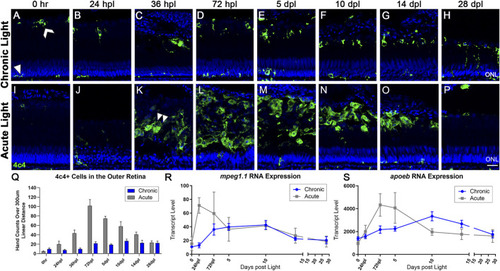
The microglial response to CLL is muted in comparison to AL damage. Anti-4c4 antisera (green) was used to immunolabel microglia and nuclei were stained with TO-PRO-3 (blue). (A) At rest, microglia exhibited two distinct morphologies. Within the ONL and plexiform layers, the microglia were ramified with thin projections (white arrowhead). In the outer retina, microglia resided at the outer margin of the ROS/RPE boundary in an activated state, exhibiting a slightly larger morphology with fewer projections (white chevron). (A–H) Over 28-day CLL exposure, we observed a slight increase in the microglia inflammatory response in the outer retina. (D) At 72 hpl, microglia accumulated at the tips of the truncated ROS (Figure 2). (H) At 28 dpl, we also observed some microglia interdigitating with ROS. (I–P) Microglia response in the AL damage model. (K) Microglial infiltration corresponded directly to peak PR damage in the AL model, with the first evidence of microglia with amoeboid morphology occurring at 36 hpl (double arrowhead). (M) The peak of microglial presence in the outer retina occurred at 72 hpl, corresponding to the completion of the debris clearance of cones, and significant consolidation of the ROS debris field. (Q) 4c4+ cell hand counts in the outer retina (not including ONL) over a 300 µm linear distance. In the CLL model, the only time-point with significantly higher 4c4+ cells in the outer retina as compared to 0 h is at 10 dpl (p < 0.011). In the AL model, there was a significant increase in 4c4+ cells for all time-points from 36 hpl–14 dpl (p < 0.041-p<0.001). (R,S) Gene expression changes in two microglia-associated genes (mpeg1.1 and apoeb) in CLL vs. AL damage models displayed as transcript pseudocounts from 3′mRNA-seq of individual retinas. In the AL model, we observed an early acute increase in these genes in a peak from 24 hpl to 5 dpl that preceded the observed increase in immunolabeled microglia. In the CLL model, the pattern of gene expression followed a similar pattern, only the peak occurred later, at 10 dpl and the wave was longer in duration. (ONL = outer nuclear layer; scale bar in panel P = 5 µm).
|
