IMAGE

FIGURE 1

ID
ZDB-IMAGE-231002-393
Source
Figures for Kramer et al., 2023
Image
Figure Caption

FIGURE 1

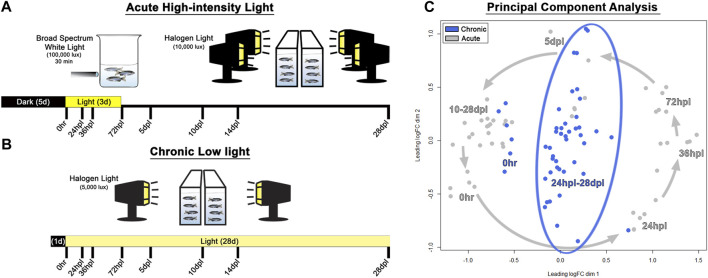
Methods and principal component analysis. (A) Experimental design used for acute phototoxic lesion, with tissue collection time-points along the bottom designated in hours/days post-light onset (hpl/dpl). (B) Chronic low light lesion model set-up demonstrating reduced intensity of the light lesion protocol with the same tissue collection time-points. The initial 100,000 lux step was removed, and the secondary stage was reduced in lux by 50% (compared with the AL model) and prolonged for 28 days. (C) Principal component analysis of the top 200 genes which maximized separation of the dark-adapted, 0 h baseline controls for both chronic low and acute light datasets. Acute light damage samples are displayed in grey, and chronic low light datasets are blue. The grey arrows represent the temporal progression trajectory of the tissue collection time-points. For the chronic low light samples, there was no clear temporal progression of the transcriptional landscape as there was in the acute light regeneration dataset, rather, tissue collection time-points post 0 h baseline were scattered in the middle of the plot.

Acknowledgments
This image is the copyrighted work of the attributed author or publisher, and ZFIN has permission only to display this image to its users. Additional permissions should be obtained from the applicable author or publisher of the image. Full text @ Front Cell Dev Biol