IMAGE

FIGURE 3

ID
ZDB-IMAGE-231002-398
Source
Figures for Kramer et al., 2023
Image
Figure Caption

FIGURE 3

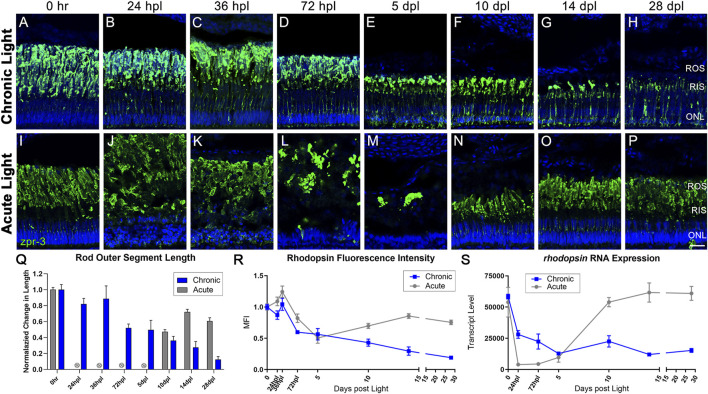
CLL exposure leads to slow rod photoreceptor degeneration, whereas rod photoreceptors are destroyed and replaced in the AL model. Rod PRs were immunolabeled (green) with zpr-3 to mark rod outer segments (ROS) and nuclei were stained blue with TO-PRO-3. (A–H) In response to chronic low light exposure, zpr-3 positive ROS displayed a gradual truncation over time until they were almost absent at 28dpl. (B) At 24 hpl, zpr-3 expression began to localize in the rod inner segments (RIS). (C) At 36 hpl, localization of zpr-3 expression was seen in both the RIS and outer nuclear layer (ONL). (E) By 5 dpl and onward, ROS were significantly truncated in length and zpr-3 expression was observed in the perinuclear area, along with a reduction in quantity of ONL nuclei. (I–P) Rod PR response to acute light damage. (J) At 24 hpl, ROS exhibited significant hypertrophy and ONL nuclei were pyknotic and disorganized. (M) At 5 dpl, the ROS debris field was cleared, and evidence of newly formed rods was observed at 10dpl (N). (Q) ROS length measured via ImageJ, normalized to 0 h baseline in chronic vs. acute damage models. Each time-point after 72 hpl in the CLL model shows a statistically significant decrease in ROS length as compared to the 0 h baseline (n = 5–6; p < 0.012–0.001). For AL images, length was not calculated for 24 hpl-5 dpl as the PRs were dying or dead. The final three time-points in the AL model were also statistically significant (p < 0.0001). (R) Percent change from 0 h in ImageJ-quantified zpr-3 mean fluorescence intensity (MFI) at each time-point. Each time-point 72 hpl and beyond in the CLL model represented a statistically significant MFI as compared to 0hpl in ROS (p < 0.003–0.0001). (S) Gene expression changes in rhodopsin in CLL vs. AL damage models displayed as transcript pseudocounts from 3′mRNA-seq of individual retinas. A steady decrease in rho gene expression was observed throughout the time-course in CLL retinas. (ROS = rod outer segments, RIS = rod inner segments, ONL = outer nuclear layer; scale bar in panel P = 5 µm).

Acknowledgments
This image is the copyrighted work of the attributed author or publisher, and ZFIN has permission only to display this image to its users. Additional permissions should be obtained from the applicable author or publisher of the image. Full text @ Front Cell Dev Biol