
- Title
-
Zebrafish embryonically exposed to valproic acid present impaired retinal development and sleep behavior
- Authors
- DeOliveira-Mello, L., Baronio, D., Panula, P.
- Source
- Full text @ Autism Res
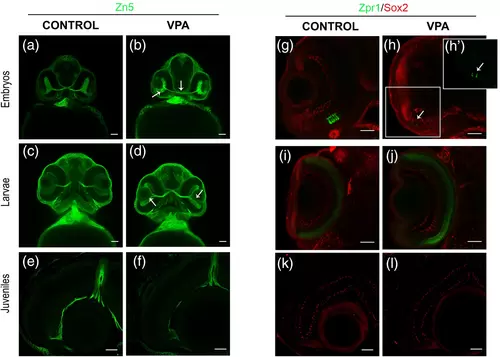
Visual system analysis of VPA-exposed and control zebrafish. (a, b) Neurolin (Zn5) staining shows a delay in development of the retina and the optic nerve (white arrows) of embryos (2-dpf). (c, d) The retina of VPA-exposed larvae (5-dpf) was underdeveloped in comparison with control larvae, showing a flatten structure (white arrows). (e, f) A complete recovery of forming neurons can be seen in juvenile (1-mpf) samples, where the Zn5-positive cells were restricted to peripheral retina and its axons pass thought the neural fiber layer until form the optic nerve. (g–j) Photoreceptor development by using Zpr1 antibody (green) in embryos and larvae. (g–l) Staining for Sox2 transcription factor showed positive cells in the layered retina in embryos (g, h) larvae (i, j) and juveniles (k, l). Sox2 positive cells in the PGZ and in different layers of differentiated retina has been previous described (DeOliveira-Mello et al., 2019; Santos-Ledo et al., 2022) and was similar in VPA-exposed zebrafish and controls. (g, h) Cones showed a delay in embryos (2-dpf) exposed to VPA (white arrow; magnification in h'). (i, j) Recovered structure of cone cells in larvae (5-dpf) exposed to VPA. (k, l). In juveniles (1-mpf), the structure of VPA-treated animals and controls are very similar. PGZ, peripheral germinal zone. Scale bar 50 μm. |
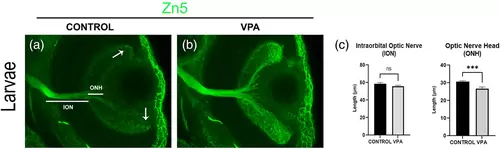
Developing optic nerve and retina in larval zebrafish at 5-dpf. (a, b) Developing neurons expressing Zn-5 at 5-dpf were restricted to peripheral retina in controls (white arrows), but were extended in entire retina of VPA-exposed zebrafish. (d) Although the intra-orbital optic nerve length showed no differences in VPA-treated larvae in comparison with controls, the length of the optic nerve head of larvae exposed to VPA was smaller than in control larvae. Data are expressed as mean ± SEM, n = 5 per group, *p-value <0.05. |
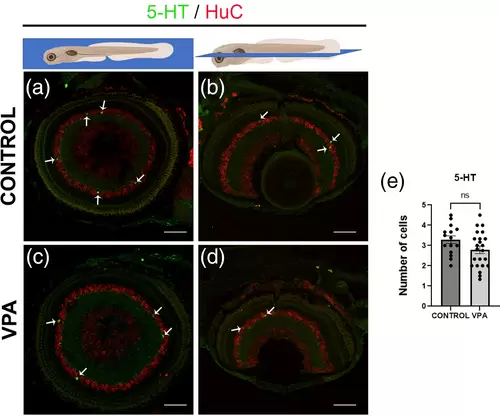
Serotonergic neurons in the retina of larvae zebrafish at 8-dpf. (a, d) Immunostaining for 5-HT (green) in sagittal and horizontal sections of larval (8-dpf) retinae. 5-HT positive cells (green) are seen in the inner nuclear layer of the retina in both VPA-treated and control larvae in a similar distribution. (e) Quantification of the number of cells per section showed no statistical differences between treated animals and controls. Neurons were counterstained with HuD/HuC label (red). Data are expressed as mean ± SEM, n = 5 per group, *p-value <0.05. 5-HT, serotonin. Scale bar 50 μm. |
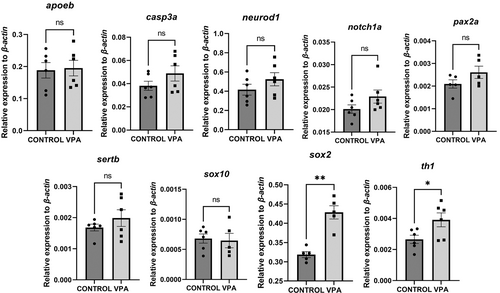
qPCR analysis of mRNA expression in the eyes of zebrafish larvae at 5-dpf. The expression of sox2 and th1 is upregulated in VPA-exposed zebrafish larvae. No changes are detected in developmental (neurod1), serotonergic (sertb), glial (pax2a and apoeb |
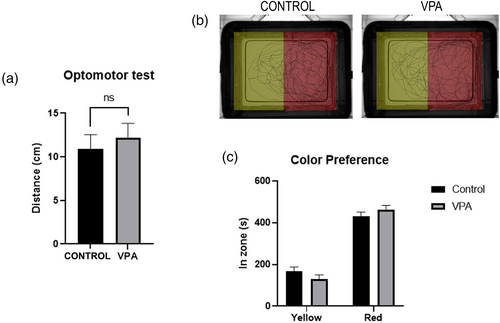
Visual behavior assays of zebrafish at 1-mpf. (a) In the optomotor assay, distances moved during the 30 seconds of strips video revealed that VPA-exposed animals and control fish follow strips without significant differences. (b, c) Both VPA-treated and control animals show a very similar preference between yellow and red zones. Data are expressed as mean ± SEM, n = 19 for optomotor test and n = 13 for color preference teste (per group), *p-value <0.05. |
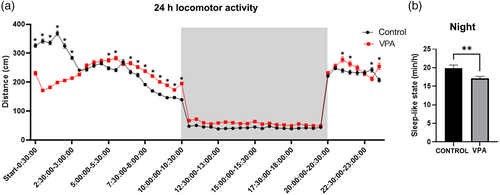
Locomotor activity test during 24 h at 6–7 dpf. (a) Locomotion was evaluated in light during 10 hours, followed by a dark period of the same length (gray), followed by another 4 h light period. Analysis of distance moved in light showed significant differences between VPA-exposed and control larvae (asterisks). (b) Although tracking showed no differences in distance moved during the night, we found significant differences in the sleep-like state. We considered sleep-state as at least 60 s of no movement in a row and calculated how many minutes per hour VPA-treated animals and controls were immobile. VPA-exposed animals showed significantly less movement than controls in the night (b). Data are expressed as mean ± SEM, n = 20 in controls and n = 21 in treated animals, *p-value <0.05. |
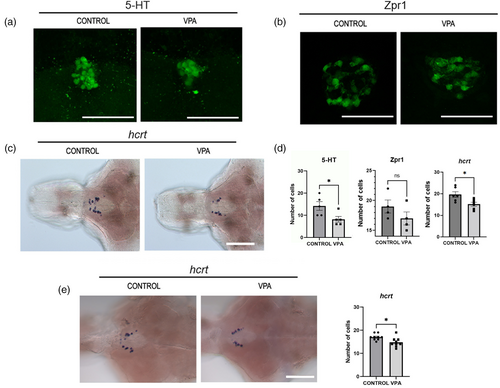
Histological analysis of pineal gland and hypocretin/orexin (hcrt) neurons. (a, b) Serotonin-immunoreactive (5-HT) cells (a) and photoreceptor-like (Zpr1) cells (b) in the pineal gland were studied at 5-dpf of VPA-exposed and control larvae. (c) Hcrt |