
|
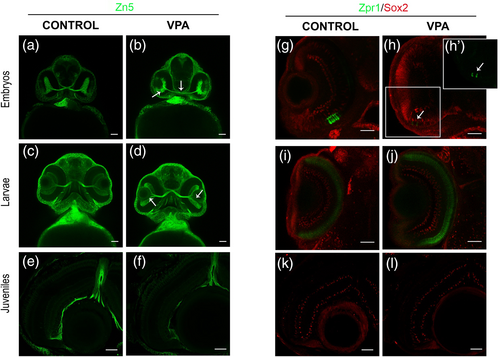
Fig. 1 Visual system analysis of VPA-exposed and control zebrafish. (a, b) Neurolin (Zn5) staining shows a delay in development of the retina and the optic nerve (white arrows) of embryos (2-dpf). (c, d) The retina of VPA-exposed larvae (5-dpf) was underdeveloped in comparison with control larvae, showing a flatten structure (white arrows). (e, f) A complete recovery of forming neurons can be seen in juvenile (1-mpf) samples, where the Zn5-positive cells were restricted to peripheral retina and its axons pass thought the neural fiber layer until form the optic nerve. (g–j) Photoreceptor development by using Zpr1 antibody (green) in embryos and larvae. (g–l) Staining for Sox2 transcription factor showed positive cells in the layered retina in embryos (g, h) larvae (i, j) and juveniles (k, l). Sox2 positive cells in the PGZ and in different layers of differentiated retina has been previous described (DeOliveira-Mello et al., 2019; Santos-Ledo et al., 2022) and was similar in VPA-exposed zebrafish and controls. (g, h) Cones showed a delay in embryos (2-dpf) exposed to VPA (white arrow; magnification in h'). (i, j) Recovered structure of cone cells in larvae (5-dpf) exposed to VPA. (k, l). In juveniles (1-mpf), the structure of VPA-treated animals and controls are very similar. PGZ, peripheral germinal zone. Scale bar 50 μm.