
Image
|
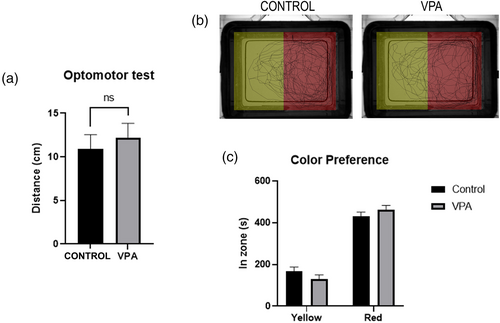
Figure Caption
Fig. 5 Visual behavior assays of zebrafish at 1-mpf. (a) In the optomotor assay, distances moved during the 30 seconds of strips video revealed that VPA-exposed animals and control fish follow strips without significant differences. (b, c) Both VPA-treated and control animals show a very similar preference between yellow and red zones. Data are expressed as mean ± SEM, n = 19 for optomotor test and n = 13 for color preference teste (per group), *p-value <0.05.
Acknowledgments
This image is the copyrighted work of the attributed author or publisher, and
ZFIN has permission only to display this image to its users.
Additional permissions should be obtained from the applicable author or publisher of the image.
Full text @ Autism Res