FIGURE SUMMARY
Title

Modeling Sarcoglycanopathy in Danio rerio

Authors
Dalla Barba, F., Soardi, M., Mouhib, L., Risato, G., Akyürek, E.E., Lucon-Xiccato, T., Scano, M., Benetollo, A., Sacchetto, R., Richard, I., Argenton, F., Bertolucci, C., Carotti, M., Sandonà, D.
Source
Full text @ Int. J. Mol. Sci.

Sgcd−/− zebrafish lines, mutations introduced, and consequences at the protein level. (A) Genomic organization of the wild type z-sgcd gene: boxes, exons; lines, introns. The red arrow points the site in exon 2 targeted by Cas9. (B) Nucleotide and amino acid sequences of the wild type and 4-bp and 14-bp deletion mutants (δ-SGex2KOΔ4 and δ-SGex2KOΔ14, respectively), as revealed by DNA sequencing analysis of the sgcd CRISPR target site. Each deleted nucleotide is represented by a dash, the CRISPR target site is highlighted in grey with the PAM sequence in bold. The amino acid sequence of the wild type (black amino acid) and of the mutants is reported under the nucleotide sequence. For both mutants, the consequence of the deletions is a frame shift (red amino acids) with the appearance of a premature stop codon (after 12 amino acids in the δ-SGex2Δ4bp and 42 amino acids in the δ-SGex2Δ14). (C) Scheme of the primary sequence of the wild type δ-SG protein and of the predicted truncated form with the different topological domains. ∆, deletion (D) Western blot (WB) analysis, showing the absence of the δ-SG protein in the lysates from embryos, 72 h post fertilization (hpf), of both sgcd−/− zebrafish lines. Lysates from HEK293 expressing the zebrafish δ-SG sequence (Hek z-δSG) and from wild type zebrafish embryos were used as positive controls.

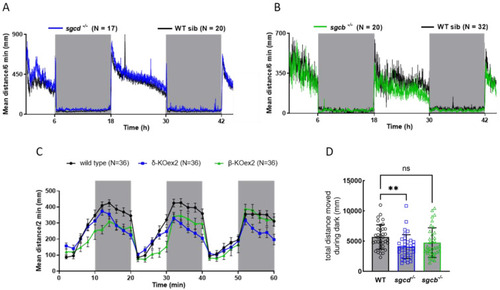
Swimming ability of the sgcd−/− and sgcb−/− larvae. (A) sgcd−/− and wild type sibling larvae, (B) sgcb−/− and wild type sibling larvae at 4 dpf were placed in a 48-well plate and introduced into the DanioVision tracking system. After a few hours of acclimation, the zebrafish larvae movements were recorded for 48 h under a 12:12 light–dark cycle; grey boxes represent the dark periods. The distance moved every 6 min by each larva was recorded and plotted for the entire period considered; each point is the mean distance covered by the number of larvae as indicated, standard deviation was omitted for clarity. (C) Startle test in which 5 dpf zebrafish larvae, upon 20 min of habituation, were subjected to three cycles of 10 min of light, followed by 10 min of dark (grey boxes). The graph reports the mean distance moved every 2 min ± SE of 36 larvae for each genotype. As expected, larvae activity increased during the dark periods, slowing down to a basal level during the light periods. (D) Quantification of the total distance moved during the three dark periods of the startle test by fish of the three genotypes; the average activity value ± SE is also indicated. Statistical analysis was performed using the one-way ANOVA test followed by Dunnett’s multiple comparisons test. ns, p > 0.05; **, p ≤ 0.01.

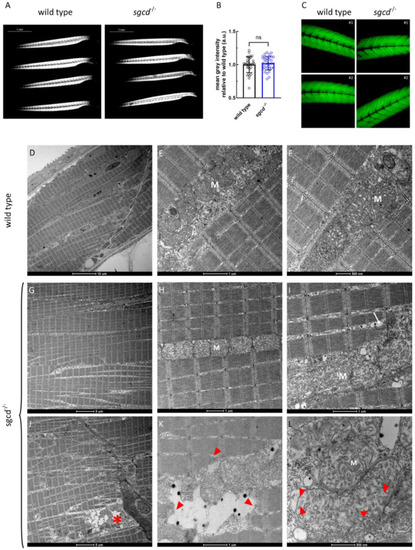
Muscle fiber integrity at the macroscopic and ultrastructural level in the sgcd−/− and wild type larvae. (A) Representative birefringence images of the larvae of the two genotypes as obtained by viewing the zebrafish with a plane polarizing filter. Microscope’s magnification 2.5×. (B) Birefringence quantification. Statistical analysis was performed by the Mann–Whitney test; ns, p > 0.05. (C) Representative images of the phalloidin staining of whole zebrafish larvae at 5 dpf. Microscope’s magnification 20×. (DL) Representative ultrathin sections from larvae at 5 dpf. Scale bar: um, µm. The well-preserved array of sarcomeres is evident in both the wild type (DF) and mutated (GI) larvae. In (J), this organization is partially lost, and some fibers are detached from the myosepta (asterisk in (J)), where myofibrillar disarrangement is evident (red arrowheads in (K)). Triad organization in sgcd−/− is almost indistinguishable from that of the wild type (compare (E) with (H)), even if, in a few ultrastructural sections, it is possible to observe that the SR cisternae appeared dilated (white arrow in (I)). Mitochondria (M) appeared normal in both the wild type (E,F) and mutant (H,I) larvae, however, where fibers were damaged, mitochondrial alterations were evident, with detachment of the outer mitochondrial membrane and expansion of the intermembrane space (red arrowheads in (L)).

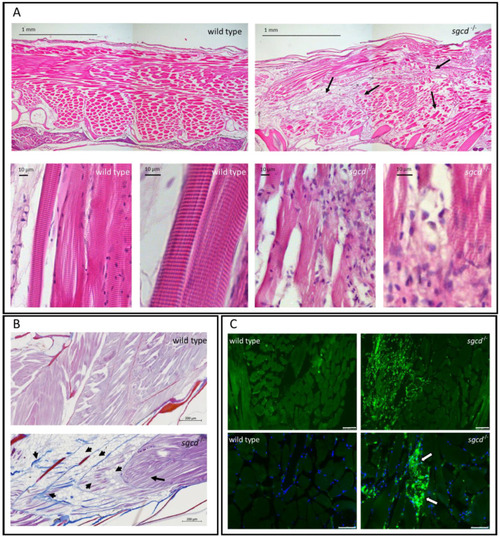
δ-SG deficiency causes defects in the skeletal muscle of adult zebrafish. (A) Hematoxylin and eosin staining of sagittal sections from adult wild type and sgcd−/− zebrafish. The skeletal muscle in the mutated animal was clearly affected, fibers (black arrows) were of different sizes and shapes, and appeared loosely interacting in comparison to the wild type. At high magnification, it is possible to observe that the classical sarcomeric striation, present in wild type tissue, was less evident in the mutant; both fibers and myofibrils were partially disorganized and wavy. Furthermore, a high number of mononucleated cells surrounded the damaged fibers. (B) Azan–Mallory staining of the sagittal section of the wild type and sgcd−/− zebrafish. Arrowheads indicate both the deposition of fibrotic tissue (colored in blue) and the presence of mature adipose tissue replacing the contractile one. The black arrow highlights the presence of a conserved region of skeletal muscle. (C) Immunofluorescence staining with L-plastin (green signal), a pan-leukocytic marker evidenced, at low magnification, the huge number of inflammatory cells that infiltrated the skeletal muscle tissue. Nuclei were counterstained with DAPI (blue signal). At higher magnification, it is possible to observe the L-plastin positive mononucleated cells surrounding a damaged skeletal muscle fiber (arrows). Upper panel bars correspond to 75 µm, lower panel bars to 50 µm Antibody against L-plastin is listed in Table S2.

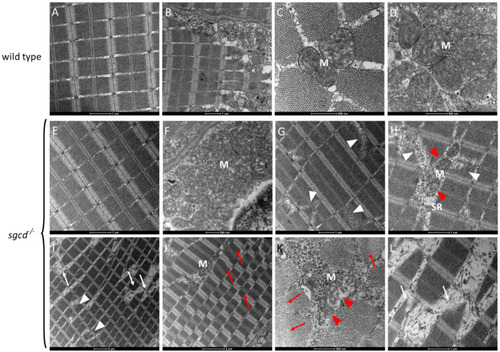
Transmission electron microscopy analysis of the skeletal muscle of the WT and sgcd−/− adult zebrafish lines. Ultrathin sections from 1-year-old WT zebrafish (AD) and age-matched sgcd−/− zebrafish (EL). Scale bar: um, µm. It is possible to observe that in some regions, the contractile tissue and mitochondria (M) of the mutant fish (panel (E,F)) were almost indistinguishable from the wild type (panels (AD)). On the other hand, in most of the sections of sgcd−/− (panels (GL)), clear signs of myopathy were present such as myofibrillar fragmentation (white arrowheads), fiber damage (white arrows), out-of-frame sarcomeric array (panel (J)), hypercontracted fibers (red arrows), and dilated sarcoplasmic reticulum (SR). In these regions, mitochondria are degenerating (panels (H,K), red arrowheads).

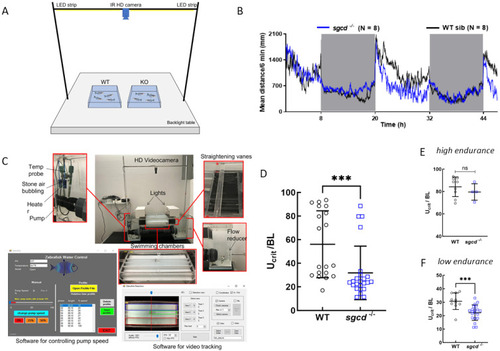
Swimming performance of the adult wild type and sgcd−/− zebrafish. (A) Tracking system and representative arena of 40 × 40 cm for adult zebrafish. (B) Distance moved by 7-month-old sgcd−/− and wild type siblings. After a few hours of habituation, the fish movements were recorded for 48 h under a 12:12 LD cycle. Each point represents the mean value of the distance moved in 6 min by eight wild type (black trace) and eight mutated animals (blue trace). With this set-up, it is not possible to record the movement of a single fish. (C) The in-house developed swimming tunnel system that was conceived to allow for the simultaneous testing of three adult zebrafish in the swimming chambers (Lucon-Xiccato et al., 2021 [37]). (D) Swimming performance of adult fish (1-year-old), 19 wild type and 24 sgcd−/−. Fish were introduced in the swimming chambers and allowed to habituate for 60 min. Then, a counter current speed of 81.6 (cm/s) was applied. Fatigue was evaluated by measuring the time at which the fish stopped swimming counter current and contacted the rear section of the tunnel for >5 s (Ucrit). This value was normalized by the length of the fish. It is possible to see that the sgcd−/− fish were less resistant than the wild type ones. Two subpopulations, high endurance (E) and low endurance (F) fish, were distinguishable in both genotypes. Statistical analysis was performed by the Mann–Whitney test; ns, p > 0.05; ***, p ≤ 0.001.

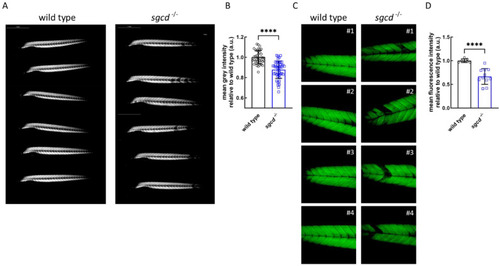
Muscle fiber integrity in the representative wild type and sgcd−/− larvae growing in fish water with 1% methylcellulose added. (A) Representative birefringence images as obtained by viewing zebrafish with a plane polarizing filter. Microscope’s magnification 2.5X. (B) Birefringence quantification of zebrafish larvae as in (A) (wild type N = 39; sgcd−/− N = 45). (C) Representative pictures of the phalloidin staining of whole zebrafish larvae at 5 dpf. Microscope’s magnification 20X. (D) Quantification of the fluorescence intensity of zebrafish larvae stained with phalloidin as in (B) (wild type N = 7; sgcd−/− N = 11). Statistical analysis was performed by the Mann–Whitney test; ****, p ≤ 0.0001.

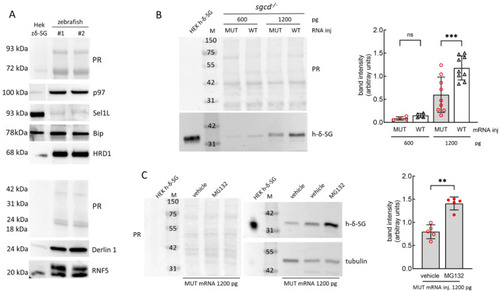
The E262K mutant of δ-SG is the substrate of the ERAD in zebrafish. (A) Western blot analysis of the expression of different components of the endoplasmic reticulum associated degradation (ERAD) in zebrafish. Lysates from 5 dpf larvae of the wild type zebrafish were resolved in SDS-PAGE and probed with antibodies specific for the indicated proteins (representative WBs are reported). The antibodies used are listed in Table S2; M, molecular markers; PR, Ponceau red staining used for protein content normalization. (B) sgcd−/− zebrafish oocytes were microinjected with two concentrations (as indicated) of the human mRNA encoding either the wild type or mutated E262K-δ-SG. Embryos at 48 hpf were lysed and the total proteins purified. A representative WB (left), and densitometric quantification of human-δ-SG bands (right) are shown. The graph reports the band intensity values of the E262K-δ-SG (MUT) and wild type (WT) forms of the human protein at different concentrations of injected mRNA. The mean values ± SD from at least four independent microinjection experiments are reported. Statistical analysis was performed by one-way ANOVA followed by Šídák’s multiple comparisons test; ns, p > 0.05; ***, p ≤ 0.001. (C) sgcd−/− zebrafish oocytes, at one cell stage, were microinjected with 1200 pg of the human E262K-δ-SG mRNA. At 24 hpf, embryos were treated with DMSO 1‰ (vehicle) or MG132 (10 µM). At 56 hpf, the embryos were lysed and the total proteins purified. A representative WB (left) and the densitometric quantification of human-δ-SG bands (right) are shown. The graph reports the band intensity values of the mutated protein in the two groups of embryos. The mean values ± SD from five independent microinjection experiments are reported. PR, Ponceau red staining. Blots were probed with rabbit polyclonal antibodies specifically recognizing the human δ-SG or tubulin, used for protein content normalization. Proteins purified from the HEK293 cells transfected with the human δ-SG sequence are reported as the positive control. Statistical analysis was performed by the Mann–Whitney test; **, p ≤ 0.01.

Acknowledgments
This image is the copyrighted work of the attributed author or publisher, and ZFIN has permission only to display this image to its users. Additional permissions should be obtained from the applicable author or publisher of the image. Full text @ Int. J. Mol. Sci.