FIGURE SUMMARY
Title

Loss of Mtm1 causes cholestatic liver disease in a model of X-linked myotubular myopathy

Authors
Karolczak, S., Deshwar, A.R., Aristegui, E., Kamath, B.M., Lawlor, M.W., Andreoletti, G., Volpatti, J.R., Ellis, J.L., Yin, C., Dowling, J.J.
Source
Full text @ Journal of Clin. Invest.

mtm zebrafish show evidence of hepatic steatosis and cholestasis.

(A) Oil Red O staining shows hepatic steatosis in 5 dpf zebrafish larvae. Dashed lines outline the liver, where there is evidence of lipid accumulation in mtm zebrafish. Black arrow denotes the swim bladder, which is not properly inflated in mtm mutants. Scale bars: 100 μm. (B) Quantification of Oil Red O in liver (n = 10 fish for each condition). No WT larvae had severe steatosis compared with 66% of mtm larvae. (C) BODIPY feeding assay showed impaired bile flux in mtm larvae. WT and mtm zebrafish were fed AP-100 fish food mixed with BODIPY C12. Representative images are shown of fish with positive and negative gallbladder fluorescence. Blue arrow denotes the gallbladder. Original magnification, ×25. (D) Quantification of gallbladder fluorescence combining 2 independent biological replicates (n = 30 fish per replicate). Ninety-three percent of WT larvae exhibited gallbladder fluorescence after BODIPY exposure, whereas only 28% of mtm larvae showed gallbladder fluorescence (****P < 0.0001, by Fisher’s exact test). (E) Comparisons of individual bile acids at 5 dpf. TCA, TCDCA, and TDCA are 3 conjugated, hydrophobic bile acids that can cause toxicity when their levels are elevated. TCA and TDCA levels appeared unchanged, whereas TCDCA levels were elevated in mtm larvae (*P = 0.039, by unpaired, 2-tailed t test).

mtm zebrafish have dilated bile ducts with reduced branching.

(A) Whole-mount immunostaining of 7 dpf zebrafish larvae with 2F-11, an antibody that stains bile ducts. The mtm biliary tree was simplified and dilated as compared with the WT sibling. Scale bars: 20 μm. (B) Live-image analysis of Tp1:GFP bile duct transgenic line at 5 dpf and 7 dpf. The simplified and dilated mtm bile ducts seen with 2F-11 staining were also observable by this technique. Defects were more severe at 7 dpf compared with 5 dpf. Scale bars: 20 μm. (C) Quantification of biliary tree segment length and thickness using the Imaris filaments module. The segment length was unchanged at 5 dpf (WT median = 22.22, mtm median = 24.24, P = 0.43) but increased in mtm larvae by 7 dpf (WT median = 8.14, mtm median = 15.0, ****P < 0.0001), suggesting a reduction in branch complexity. Segments were thicker in mtm larvae as early as 5 dpf (WT median = 2.27, mtm median = 7.60, ****P < 0.0001), and this trend continues at 7 dpf (WT median = 2.24, mtm median = 5.15, ****P < 0.0001). Statistical significance was determined by Mann-Whitney U test.

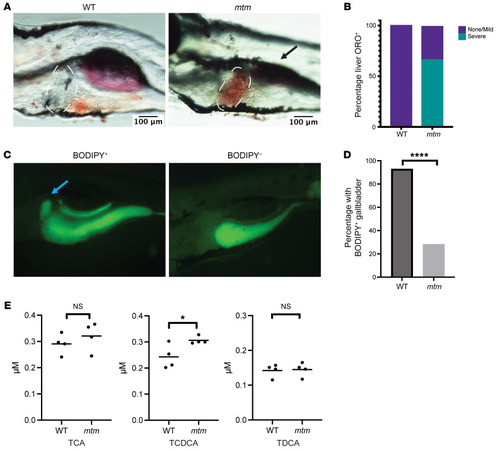
Bile acid transport protein expression is altered in liver from mtm zebrafish.

(A) Immunofluorescence staining of whole-mount zebrafish at 7 dpf using anti-Bsep. In mtm larvae, Bsep staining was essentially undetectable. Scale bars: 20 μm. (B) Immunofluorescence staining of paraffin sections of whole zebrafish examined at 2 time points: 5 dpf and 7 dpf. Scale bars: 20 μm. (C) Coimmunofluorescence staining of sectioned 7 dpf zebrafish for GFP-CAAX, a membrane marker, as well as Mdr1. Costaining revealed reduced canaliculi numbers and altered morphology in mtm embryos. As seen in B, Mdr1 staining was also absent. Red arrows point to examples of canaliculi that were positive for both GFP-CAAX and Mdr1. Scale bars: 20 μm. (D) Quantification of Bsep+ canaliculi in WT versus mtm larvae in A at 7 dpf. Bsep+ puncta were reduced in mtm larvae (WT mean = 208.8 ± 110.3, mtm mean = 7.18 ± 4.71, **P = 0.0014, by unpaired, 2-tailed t test). (E and F) Quantification of Mdr1+ canaliculi in sectioned WT and mtm larvae from B. At 5 dpf (E), the WT and mtm images had similar numbers of puncta (WT mean = 10.33 ± 2.517, mtm mean = 8.667 ± 3.512, *P = 0.5406, by unpaired, 2-tailed t test). At 7 dpf, the number of Mdr1+ puncta in mtm larvae was greatly reduced (WT mean = 51 ± 15.62, mtm mean = 10 ± 2.65, **P = 0.011, by unpaired, 2-tailed t test). (G) Quantification of GFP+ canaliculi in C. There were significantly more intact canaliculi in WT livers than in mtm livers (WT mean = 12.0 ± 3.61, mtm mean = 1.0 ± 0, **P = 0.0062, by unpaired, 2-tailed t test).

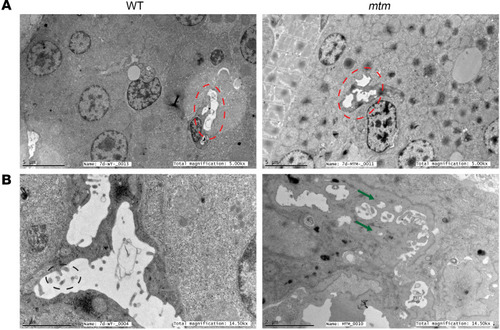
Canalicular ultrastructure is disrupted in mtm zebrafish.

Electron microscopy of whole 7 dpf zebrafish was used to define liver ultrastructure. (
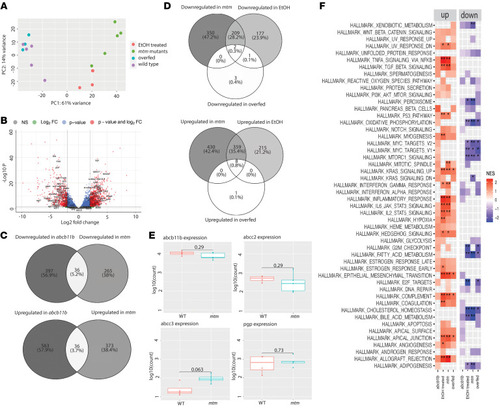
A) Magnification (original magnification, ×5,000; scale bars: 5 μm) showing multiple hepatocytes, with bile canaliculi outlined by red dashed lines. Fragmentation of mtm canaliculi was already visible at this magnification. (B) Higher-magnification visualization of bile canaliculi (original magnification, ×14,000; scale bars: 2 μm). In the WT panel, canalicular microvilli are apparent (black dashed circle). In the mtm sample, the canaliculus is devoid of microvilli. Green arrows point to fragmented parts of the canaliculus. n = 3 zebrafish per genotype.

Livers from mtm zebrafish exhibit widespread transcriptional changes.

Comparative RNA-Seq from isolated livers from 7 dpf larvae from the following conditions: WT, mtm mutants, WT exposed to a high-fat diet (overfed), WT exposed to alcohol (EtOH-treated), and abcb11b mutants (panel F and Supplemental Figure 2). (A) PCA shows that transcriptomes from mtm zebrafish segregated together and were distinct when compared with WT and the other pathologic conditions. (B) Volcano plot showing differential expression between mtm and WT livers. There were 797 transcripts upregulated and 561 transcripts downregulated in the mtm mutants (absolute [log2 fold change (FC)] >2 vs. WT, adjusted P = 0.05). (C) Venn diagrams comparing mtm fish with abcb11b-knockout fish. These transcriptomes had little overlap. (D) Venn diagrams showing comparisons between mtm zebrafish and fish treated with a high-fat diet or alcohol. In general, the individual transcriptomes were distinct and with little overlap. (E) Direct interrogation of transcripts from genes encoding canalicular transport proteins. There were no statistically significant changes between WT and mtm zebrafish, indicating that the expression changes seen in bsep (abcb11b) and mdr1 (pgp) were at the posttranscriptional level. (F) Pathway analyses of the various conditions using the fgsea (version 1.10.1 R package) analytic tool. The most striking differences were found in pathways representing inflammation and immune responses, which are shared in part between mtm and abcb11b mutants.

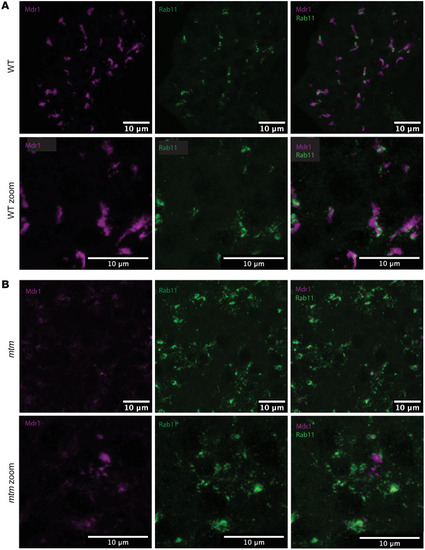
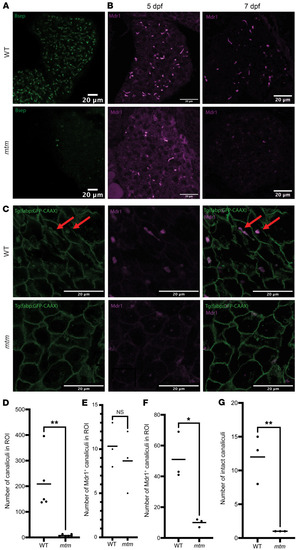
Altered recycling endosomal trafficking in mtm livers.

Confocal images of 7 dpf zebrafish sections immunostained for Mdr1 (purple) and Rab11 (green), shown at lower and higher magnification. Mdr1 is a canalicular transporter, and Rab11 is a GTPase found on recycling endosomes. (A) Rab11 clustered around the canaliculi in WT larvae. (B) In mtm larvae, Rab11 localization was more diffuse throughout the cytoplasm. Scale bars: 10 μm (zoom view of the images above, ×2.3).

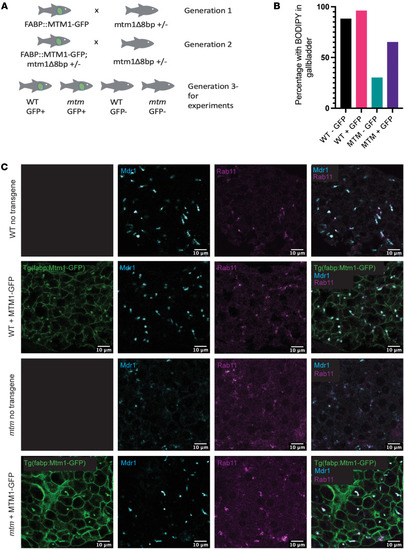
Liver-specific Mtm1 expression rescues the cholestatic phenotype of mtm zebrafish.

The fabp:mtm1-GFP transgene was introduced into the mtm-mutant zebrafish line. The resulting fish were analyzed for morphological and functional changes associated with cholestasis. (A) Crossing scheme for introducing the fabp:mtm1-gfp transgene into the mtm zebrafish line. Transgenic fish were outcrossed twice to mtm1+/Δ8 fish, resulting in clutches of larvae for experiments that contained WT and mtm fish with and without the transgene. (B) A BODIPY assay was used to measure bile flux (WT – GFP = 88%, WT + GFP = 96%, mtm – GFP = 30%, mtm + GFP = 65%). In the mtm transgene–positive group, there were more mtm mutants with normal bile flux when compared with the mtm transgene–negative group, as measured by positive gall bladder fluorescence (P = 0.0532, 1-sided Fisher’s exact test). (C) Visualization of liver-specific Mtm1 expression from the fabp:mtm1-GFP transgene. In WT fish, Mtm1 localized to the plasma membrane and to subapical structures that were Mdr1+ and Rab11+ by immunostaining (top two rows). In mtm zebrafish, hepatocyte-expressed Mtm1 restored bile canalicular architecture and bile transporter expression to the bile canaliculi. Coimmunostaining of whole-mount embryos revealed the reexpression of Mdr1 puncta in 7 dpf mtm larvae. Scale bars: 10 μm.

DNM2 inhibition rescues the mtm cholestatic phenotype.

A targeted panel of chemicals was tested in mtm zebrafish, using the BODIPY assay as a screen for the cholestatic liver phenotype. For each chemical, the percentage of mtm zebrafish with positive staining in the gallbladder was measured as the readout (n = 10 per trial, with 1 replicate per trial). (A) Two DNM2 inhibitors, Dynasore (green arrow) and Dyngo-4a (pink arrow), were among the chemicals that produced the highest percentage of BODIPY+ larvae. (B) Validation of Dynasore combining 3 independent replicates of 10 larvae per replicate. Dynasore-treated mtm larvae had improved bile flux compared with their DMSO-treated mtm siblings (Dynasore = 30.6%, DMSO = 3.67%, P = 0.019, by 2-sided Fisher’s exact test) and did not differ significantly from their WT DMSO-treated siblings (WT percentage = 56.7%, Dynasore percentage = 30.6%, P = 0.13, 2-sided Fisher’s exact test). (C) Dynasore partially restored canalicular structure and transporter expression. Coimmunostaining was performed on whole-mount embryos either exposed to DMSO or treated with Dynasore. As expected, in DMSO-treated mtm zebrafish, essentially no Mdr1 staining was appreciated. In Dynasore-treated larvae, however, there was robust reexpression of Mdr1 and proper colocalization with Rab11. Scale bars: 20 μm.

Acknowledgments
This image is the copyrighted work of the attributed author or publisher, and ZFIN has permission only to display this image to its users. Additional permissions should be obtained from the applicable author or publisher of the image. Full text @ Journal of Clin. Invest.