IMAGE

Figure 3

ID
ZDB-IMAGE-231002-431
Source
Figures for Karolczak et al., 2023
Image
Figure Caption

Figure 3 
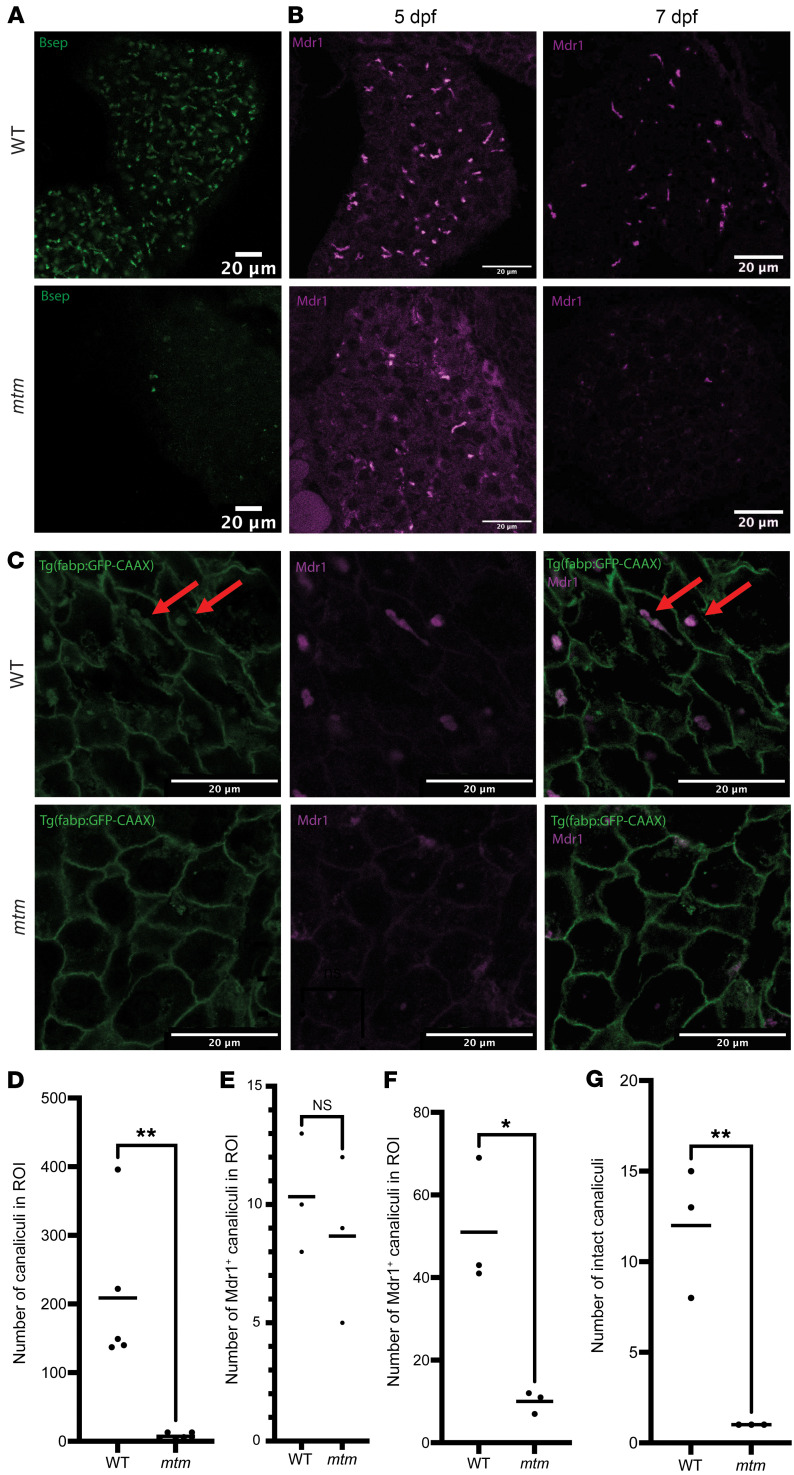
Bile acid transport protein expression is altered in liver from mtm zebrafish.

(A) Immunofluorescence staining of whole-mount zebrafish at 7 dpf using anti-Bsep. In mtm larvae, Bsep staining was essentially undetectable. Scale bars: 20 μm. (B) Immunofluorescence staining of paraffin sections of whole zebrafish examined at 2 time points: 5 dpf and 7 dpf. Scale bars: 20 μm. (C) Coimmunofluorescence staining of sectioned 7 dpf zebrafish for GFP-CAAX, a membrane marker, as well as Mdr1. Costaining revealed reduced canaliculi numbers and altered morphology in mtm embryos. As seen in B, Mdr1 staining was also absent. Red arrows point to examples of canaliculi that were positive for both GFP-CAAX and Mdr1. Scale bars: 20 μm. (D) Quantification of Bsep+ canaliculi in WT versus mtm larvae in A at 7 dpf. Bsep+ puncta were reduced in mtm larvae (WT mean = 208.8 ± 110.3, mtm mean = 7.18 ± 4.71, **P = 0.0014, by unpaired, 2-tailed t test). (E and F) Quantification of Mdr1+ canaliculi in sectioned WT and mtm larvae from B. At 5 dpf (E), the WT and mtm images had similar numbers of puncta (WT mean = 10.33 ± 2.517, mtm mean = 8.667 ± 3.512, *P = 0.5406, by unpaired, 2-tailed t test). At 7 dpf, the number of Mdr1+ puncta in mtm larvae was greatly reduced (WT mean = 51 ± 15.62, mtm mean = 10 ± 2.65, **P = 0.011, by unpaired, 2-tailed t test). (G) Quantification of GFP+ canaliculi in C. There were significantly more intact canaliculi in WT livers than in mtm livers (WT mean = 12.0 ± 3.61, mtm mean = 1.0 ± 0, **P = 0.0062, by unpaired, 2-tailed t test).

Acknowledgments
This image is the copyrighted work of the attributed author or publisher, and ZFIN has permission only to display this image to its users. Additional permissions should be obtained from the applicable author or publisher of the image. Full text @ Journal of Clin. Invest.