
- Title
-
Cross-organ single-cell transcriptome profiling reveals macrophage and dendritic cell heterogeneity in zebrafish
- Authors
- Zhou, Q., Zhao, C., Yang, Z., Qu, R., Li, Y., Fan, Y., Tang, J., Xie, T., Wen, Z.
- Source
- Full text @ Cell Rep.
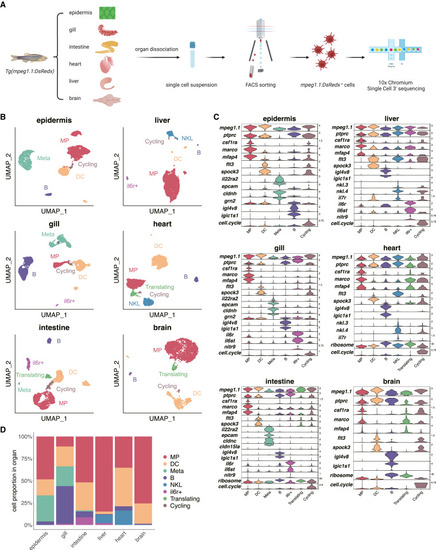
Unbiased identification of eight populations labeled by Tg(mpeg1.1:DsRedx) using scRNA-seq (A) Schematic overview of the scRNA-seq (10× Genomics) performed on mpeg1.1+ cells isolated from six organs of 6-month-old Tg(mpeg1.1:DsRedx). Created with BioRender.com. (B) Uniform manifold approximation and projection (UMAP) visualization of the mpeg1.1+ cells in each organ. (C) Violin plots showing the relative expression level of selected marker genes across mpeg1.1+ populations in six organs. The cycling cluster was identified based on the cell-cycle score, which represents the proportion of transcripts mapping to the cell-cycle-related genes (including pbk, birc5a, mki67, ube2c, top2a, tk1, aurkb, cdkn3, cenpf, cdk1, pcna, and tubb2b) in each cell calculated with the “PercentageFeatureSet” function provided by the Seurat package.28 (D) Barplot showing the relative abundance of mpeg1.1+ populations in each organ. Abbreviations: MP, macrophages; DC, dendritic cells; Meta, metaphocytes; NKL, NK-like cells. See also Figure S1 and Table S1. |
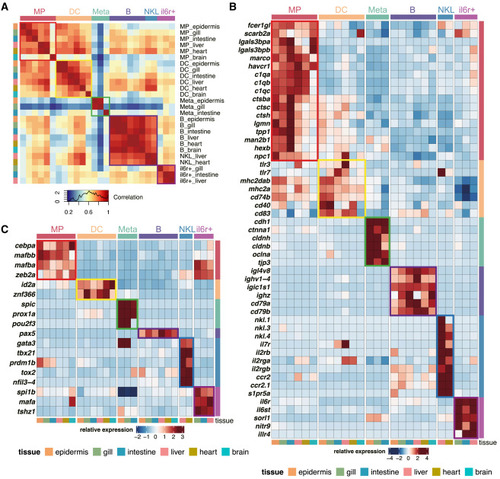
Cross-organ assessment of mpeg1.1+ populations (A) Pearson correlation analysis between the average gene expression level of mpeg1.1+ populations across six organs. The strength of the correlation is depicted by a color scale, with the highest correlation shown in red. (B) Heatmap showing the relative expression level of the signature genes for each mpeg1.1+ population across organs. (C) Heatmap showing the relative expression level of highlighted transcription factors in mpeg1.1+ populations across organs. See also Table S2. |
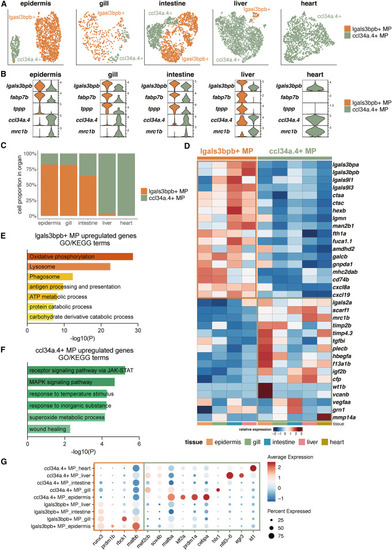
Identification of two functionally distinct MP subpopulations across organs (A) UMAP visualization of MP subpopulations across organs. (B) Violin plots showing the relative expression level of selected marker genes for MP subpopulations in each organ. (C) Barplot showing the relative abundance of MP subpopulations in each organ. (D) Heatmap showing the relative expression level of the core signature genes of MP subpopulations across organs. (E and F) Highlighted GO/KEGG terms based on DEGs between lgals3bpb+ MPs and ccl34a.4+ MPs in the epidermis. (E) GO/KEGG terms of the upregulated DEGs in lgals3bpb+ MPs. (F) GO/KEGG terms of the upregulated DEGs in ccl34a.4+ MPs. (G) Dot plot showing the relative expression level of differentially expressed transcription factors of two MP subpopulations in different organs. Color represents the normalized average expression of genes, and size represents the percentage of cells expressing these genes. See also Table S3. |
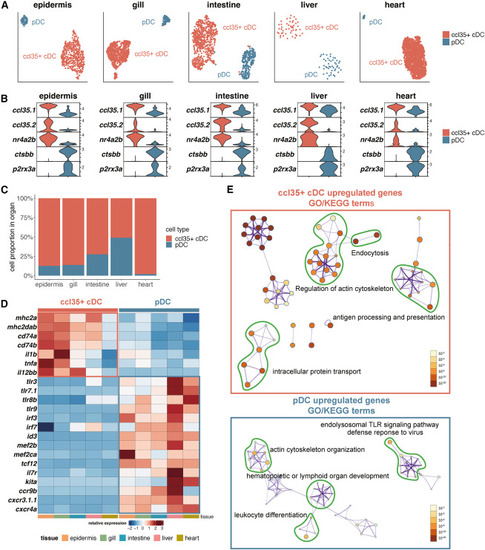
Identification of cDCs and pDCs in barrier tissues, liver, and heart (A) UMAP visualization of two DC subsets in barrier tissues, liver, and heart. (B) Violin plots showing the relative expression level of selected marker genes of two DC subsets in each organ. (C) Barplot showing the relative abundance of two DC subsets in each organ. (D) Heatmap showing the relative expression level of the core signature genes of DC subsets across organs. (E) Metascape network plots showing the relationship of the GO/KEGG terms based on DEGs between cDCs and pDCs. The size of each dot indicates the number of DEGs identified for specific GO/KEGG terms, and the color indicates the p value. See also Figure S2 and Table S4. |
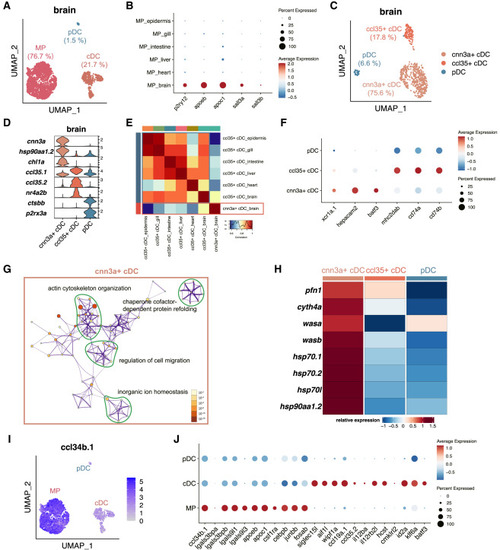
Characterization of phagocytic microglia and regulatory DCs in zebrafish brain (A) UMAP visualization of the brain MPs and two DC subpopulations. The percentages of each cell type are indicated in parentheses. (B) Dot plot showing the relative expression level of mammalian microglia signature genes in zebrafish MPs from different organs. Color represents the normalized average expression of genes, and size represents the percentage of cells expressing these genes. (C) UMAP visualization of the brain pDC and two cDC subpopulations. The percentages of each cell type are indicated in parentheses. (D) Violin plot showing the relative expression level of marker genes of brain DC subpopulations. (E) Pearson correlation analysis between the average gene expression levels of cDC subsets across six organs. The strength of the correlation is depicted by a color scale, with the highest correlation shown in red. (F) Dot plot showing the relative expression level of mammalian cDC signature genes in different brain DC subpopulations. Color represents the normalized average expression of genes, and size represents the percentage of cells expressing these genes. (G) Metascape network plot showing the relationship of the GO/KEGG terms enriched in the upregulated genes in brain-specific cnn3a+ cDCs compared with brain ccl35+ cDCs. The size of each dot indicates the number of DEGs identified for specific GO/KEGG terms, and the color indicates the p value. (H) Heatmap showing the relative expression level of the core signature genes of brain-specific cnn3a+ cDCs. (I) Feature plots showing the relative expression level of ccl34b.1 in brain MP and DC subpopulations. (J) Dot plot showing the relative expression level of reported feature genes of ccl34b.1+ phagocytic microglia (from ccl34b.1 to fosab) and ccl34b.1− regulatory microglia (from siglec15L to batf3) in brain MP and DC subpopulations. Color represents the normalized average expression of genes, and size represents the percentage of cells expressing these genes. See also Figure S3 and Table S5. |
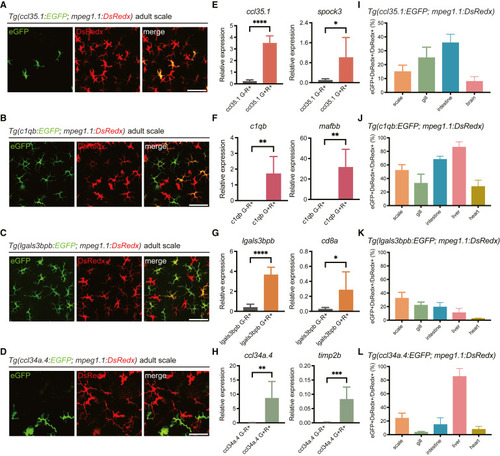
Characterization of the MP and DC reporter lines in adult zebrafish (A–D) Representative images of the epidermis of adult Tg(ccl35.1:EGFP; mpeg1.1:DsRedx) (A), Tg(c1qb:EGFP; mpeg1.1:DsRedx) (B), Tg(lgals3bpb:EGFP; mpeg1.1:DsRedx) (C), and Tg(ccl34a.4:EGFP; mpeg1.1:DsRedx) (D) fish. Scale bar, 50 μm. (E–H) qRT-PCR detection of the relative expression levels of indicated marker genes in EGFP−DsRedx+ (G−R+) and EGFP+DsRedx+ (G+R+) cells sorted from the epidermis of adult Tg(ccl35.1:EGFP; mpeg1.1:DsRedx) (E), Tg(c1qb:EGFP; mpeg1.1:DsRedx) (F), Tg(lgals3bpb:EGFP; mpeg1.1:DsRedx) (G), and Tg(ccl34a.4:EGFP; mpeg1.1:DsRedx) (H) fish, respectively (n = 6 for each group). eef1a1l1 was used as the internal control. Data are represented as mean ± SD, ∗p < 0.05, ∗∗p < 0.01, ∗∗∗p < 0.001, ∗∗∗∗p < 0.0001. (I–L) Proportion of EGFP+DsRedx+ cells to total DsRedx+ cells in the indicated organs of adult Tg(ccl35.1:EGFP; mpeg1.1:DsRedx) (I), Tg(c1qb:EGFP; mpeg1.1:DsRedx) (J), Tg(lgals3bpb:EGFP; mpeg1.1:DsRedx) (K), and Tg(ccl34a.4:EGFP; mpeg1.1:DsRedx) (L) fish, respectively (n = 4 for heart, n = 6 for the remaining organs). Data are represented as mean ± SD. See also Figures S4–S6. |