
Fig. 1
- ID
- ZDB-FIG-231204-63
- Publication
- Zhou et al., 2023 - Cross-organ single-cell transcriptome profiling reveals macrophage and dendritic cell heterogeneity in zebrafish
- Other Figures
- All Figure Page
- Back to All Figure Page
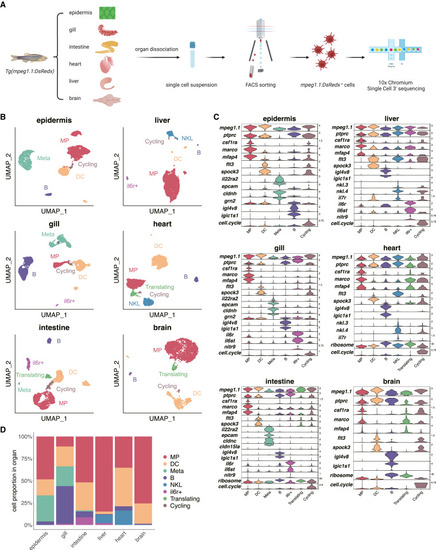
Unbiased identification of eight populations labeled by Tg(mpeg1.1:DsRedx) using scRNA-seq (A) Schematic overview of the scRNA-seq (10× Genomics) performed on mpeg1.1+ cells isolated from six organs of 6-month-old Tg(mpeg1.1:DsRedx). Created with BioRender.com. (B) Uniform manifold approximation and projection (UMAP) visualization of the mpeg1.1+ cells in each organ. (C) Violin plots showing the relative expression level of selected marker genes across mpeg1.1+ populations in six organs. The cycling cluster was identified based on the cell-cycle score, which represents the proportion of transcripts mapping to the cell-cycle-related genes (including pbk, birc5a, mki67, ube2c, top2a, tk1, aurkb, cdkn3, cenpf, cdk1, pcna, and tubb2b) in each cell calculated with the “PercentageFeatureSet” function provided by the Seurat package.28 (D) Barplot showing the relative abundance of mpeg1.1+ populations in each organ. Abbreviations: MP, macrophages; DC, dendritic cells; Meta, metaphocytes; NKL, NK-like cells. See also Figure S1 and Table S1. |