
Fig. 3
- ID
- ZDB-FIG-231204-65
- Publication
- Zhou et al., 2023 - Cross-organ single-cell transcriptome profiling reveals macrophage and dendritic cell heterogeneity in zebrafish
- Other Figures
- All Figure Page
- Back to All Figure Page
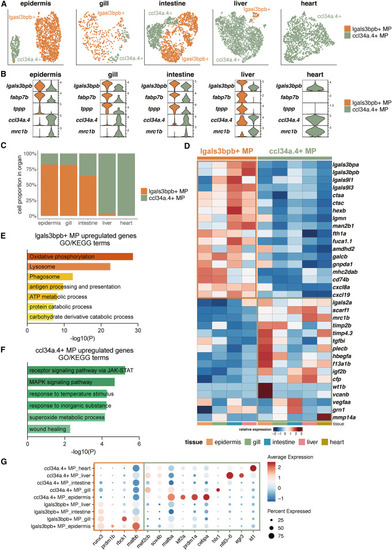
Identification of two functionally distinct MP subpopulations across organs (A) UMAP visualization of MP subpopulations across organs. (B) Violin plots showing the relative expression level of selected marker genes for MP subpopulations in each organ. (C) Barplot showing the relative abundance of MP subpopulations in each organ. (D) Heatmap showing the relative expression level of the core signature genes of MP subpopulations across organs. (E and F) Highlighted GO/KEGG terms based on DEGs between lgals3bpb+ MPs and ccl34a.4+ MPs in the epidermis. (E) GO/KEGG terms of the upregulated DEGs in lgals3bpb+ MPs. (F) GO/KEGG terms of the upregulated DEGs in ccl34a.4+ MPs. (G) Dot plot showing the relative expression level of differentially expressed transcription factors of two MP subpopulations in different organs. Color represents the normalized average expression of genes, and size represents the percentage of cells expressing these genes. See also Table S3. |