
Fig. 4
- ID
- ZDB-FIG-231204-66
- Publication
- Zhou et al., 2023 - Cross-organ single-cell transcriptome profiling reveals macrophage and dendritic cell heterogeneity in zebrafish
- Other Figures
- All Figure Page
- Back to All Figure Page
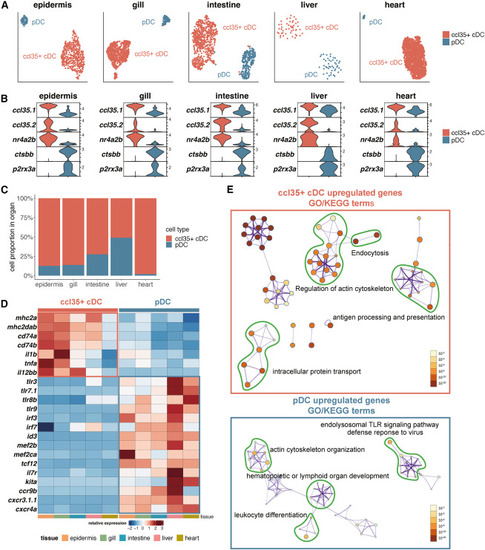
Identification of cDCs and pDCs in barrier tissues, liver, and heart (A) UMAP visualization of two DC subsets in barrier tissues, liver, and heart. (B) Violin plots showing the relative expression level of selected marker genes of two DC subsets in each organ. (C) Barplot showing the relative abundance of two DC subsets in each organ. (D) Heatmap showing the relative expression level of the core signature genes of DC subsets across organs. (E) Metascape network plots showing the relationship of the GO/KEGG terms based on DEGs between cDCs and pDCs. The size of each dot indicates the number of DEGs identified for specific GO/KEGG terms, and the color indicates the p value. See also Figure S2 and Table S4. |