
|
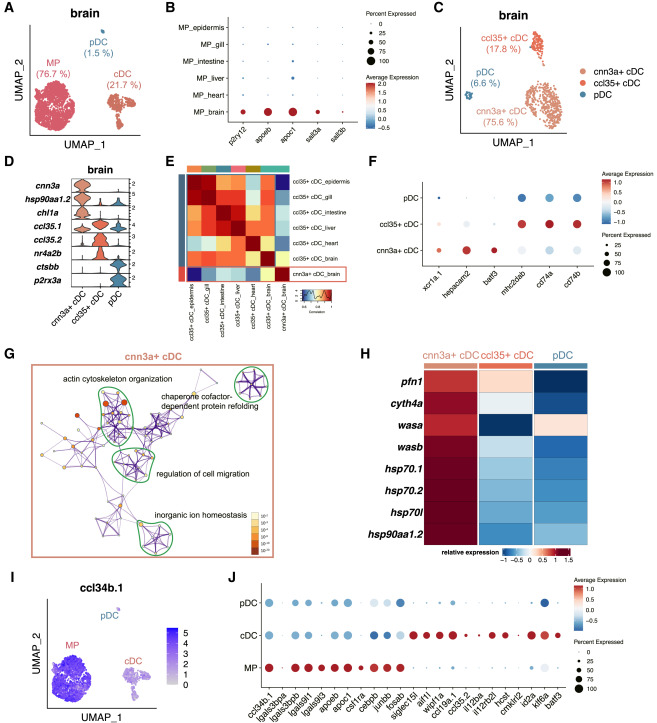
Fig. 5 Characterization of phagocytic microglia and regulatory DCs in zebrafish brain (A) UMAP visualization of the brain MPs and two DC subpopulations. The percentages of each cell type are indicated in parentheses. (B) Dot plot showing the relative expression level of mammalian microglia signature genes in zebrafish MPs from different organs. Color represents the normalized average expression of genes, and size represents the percentage of cells expressing these genes. (C) UMAP visualization of the brain pDC and two cDC subpopulations. The percentages of each cell type are indicated in parentheses. (D) Violin plot showing the relative expression level of marker genes of brain DC subpopulations. (E) Pearson correlation analysis between the average gene expression levels of cDC subsets across six organs. The strength of the correlation is depicted by a color scale, with the highest correlation shown in red. (F) Dot plot showing the relative expression level of mammalian cDC signature genes in different brain DC subpopulations. Color represents the normalized average expression of genes, and size represents the percentage of cells expressing these genes. (G) Metascape network plot showing the relationship of the GO/KEGG terms enriched in the upregulated genes in brain-specific cnn3a+ cDCs compared with brain ccl35+ cDCs. The size of each dot indicates the number of DEGs identified for specific GO/KEGG terms, and the color indicates the p value. (H) Heatmap showing the relative expression level of the core signature genes of brain-specific cnn3a+ cDCs. (I) Feature plots showing the relative expression level of ccl34b.1 in brain MP and DC subpopulations. (J) Dot plot showing the relative expression level of reported feature genes of ccl34b.1+ phagocytic microglia (from ccl34b.1 to fosab) and ccl34b.1− regulatory microglia (from siglec15L to batf3) in brain MP and DC subpopulations. Color represents the normalized average expression of genes, and size represents the percentage of cells expressing these genes. See also Figure S3 and Table S5.