
|
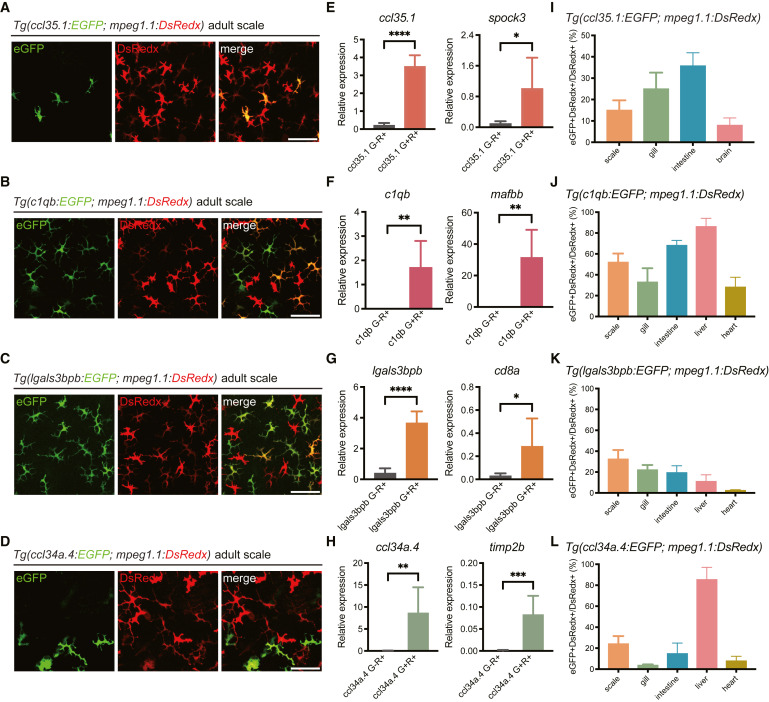
Fig. 6 Characterization of the MP and DC reporter lines in adult zebrafish (A–D) Representative images of the epidermis of adult Tg(ccl35.1:EGFP; mpeg1.1:DsRedx) (A), Tg(c1qb:EGFP; mpeg1.1:DsRedx) (B), Tg(lgals3bpb:EGFP; mpeg1.1:DsRedx) (C), and Tg(ccl34a.4:EGFP; mpeg1.1:DsRedx) (D) fish. Scale bar, 50 μm. (E–H) qRT-PCR detection of the relative expression levels of indicated marker genes in EGFP−DsRedx+ (G−R+) and EGFP+DsRedx+ (G+R+) cells sorted from the epidermis of adult Tg(ccl35.1:EGFP; mpeg1.1:DsRedx) (E), Tg(c1qb:EGFP; mpeg1.1:DsRedx) (F), Tg(lgals3bpb:EGFP; mpeg1.1:DsRedx) (G), and Tg(ccl34a.4:EGFP; mpeg1.1:DsRedx) (H) fish, respectively (n = 6 for each group). eef1a1l1 was used as the internal control. Data are represented as mean ± SD, ∗p < 0.05, ∗∗p < 0.01, ∗∗∗p < 0.001, ∗∗∗∗p < 0.0001. (I–L) Proportion of EGFP+DsRedx+ cells to total DsRedx+ cells in the indicated organs of adult Tg(ccl35.1:EGFP; mpeg1.1:DsRedx) (I), Tg(c1qb:EGFP; mpeg1.1:DsRedx) (J), Tg(lgals3bpb:EGFP; mpeg1.1:DsRedx) (K), and Tg(ccl34a.4:EGFP; mpeg1.1:DsRedx) (L) fish, respectively (n = 4 for heart, n = 6 for the remaining organs). Data are represented as mean ± SD. See also Figures S4–S6.