
- Title
-
Intestinal expression patterns of transcription factors and markers for interstitial cells in the larval zebrafish
- Authors
- Nikaido, M., Shirai, A., Mizumaki, Y., Shigenobu, S., Ueno, N., Hatta, K.
- Source
- Full text @ Dev. Growth Diff.
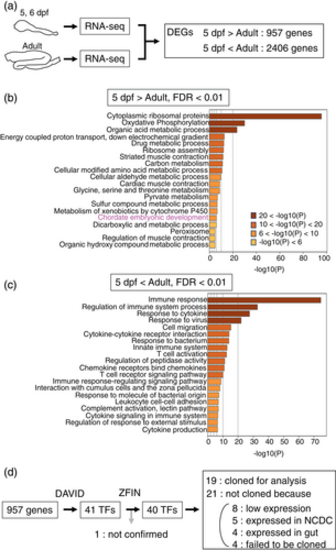
Identification of transcription factors expressed more in larval gut. (a) A schematic drawing of processes of identification and expression analysis of transcription factors (TF) in this study. Differentially expressed genes (DEGs) are identified by comparing RNA-seq results between adult and larval (5, 6 dpf) gut. Identified TFs are subjected to analysis of expression patterns by in situ hybridization. (b) Enrichment analysis of DEGs expressed more in larval gut by using 957 genes with FDR values below 0.01. Genes related with “Chordate embryonic development” are enriched in this gene group. (c) Similar enrichment analysis of DEGs expressed more in adult gut by using 2,406 genes. Genes related with, for example, “Immune response” and “Regulation of immune system process” are enriched most in this gene group. Log10(P): Ordinary logarithm of P(robability)-value. (d) Selection of 19 genes for cloning from 957 genes enriched in larval gut. The “Gene functional classification” provided by DAVID predicted 41 genes as transcription factors. Among them, 40 genes were also predicted to have DNA-binding activity in ZFIN. Because one gene, gastrula zinc finger protein XlCGF71.1-like (Entrez ID 103909501), was not found in ZFIN, we exclude it for further analysis. Among the 40 genes, 19 genes were cloned, and the remaining were not because of the reasons described. |
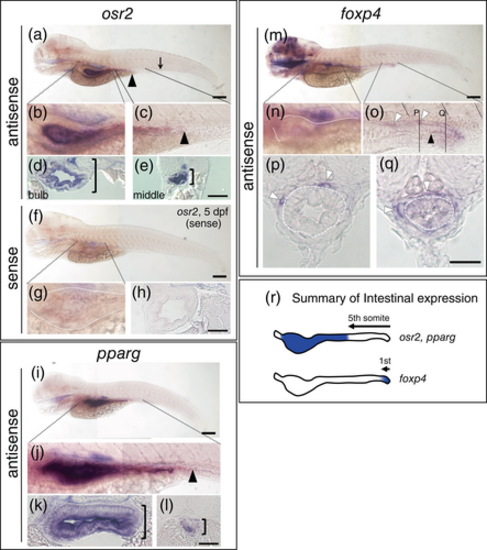
Intestinal expression patterns of osr2, pparg, and foxp4. Panels a–e, f–h, i–l, and m–q are images of larvae hybridized with antisense osr2, sense osr2, antisense pparg and antisense foxp4 probes, respectively. The left side views of osr2 (a), sense osr2 (f), pparg (i) and foxp4 (m) are shown, and the close-up views (b, c for osr2; g for sense osr2; j for pparg; n, o for foxp4) correspond to indicated regions. Dorsal, to the top. Cross sections are also shown at the level of the intestinal bulb (d, h, k), middle part of the intestine (e, l) and distal part of the intestine (p, q). The stained larvae in panels d and e are different from those in panels a–c. Cross sections (p) and (q) at the indicated level in (o) show foxp4 expression in the gut epithelial cells (encircled by white dashed line) and in the cells dorsal outside of them (white triangles). The black triangles in panels a, c, and j indicate the borders of the expression domain. Black arrow in panel a show the position of cloaca. Black close square brackets indicate the position of intestinal tubes (d, e, k, l). White dotted lines outline the intestine (g, n). Black dashed line in panel o indicates somite boundary. Scale bars in panels a, f, i, and m and e, h, l, and q are 100 μm and 50 μm, respectively. (r) A summary of the intestinal expression domain of osr2, pparg, and foxp4. The end of expression domain is indicated by the somite number from the cloaca. |
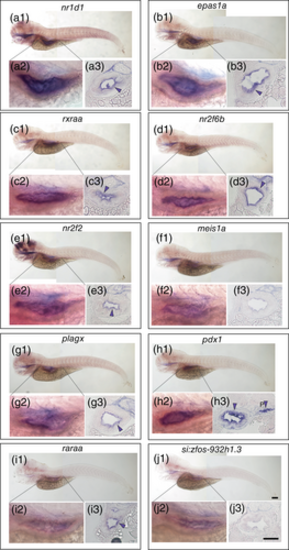
Intestinal expression patterns of transcription factors except osr2, pparg, and foxp4. For each gene, a set of three pictures is shown. Names of the genes examined are shown in the top of each rectangle. Panels a1–j1, a2–j2, and a3–j3 are left side views of entire body, close-up views of the intestinal bulb, and cross sections at the level of the intestinal bulb, respectively. Purple triangles indicate mucosal expression, while pancreas is marked by the one with “P” in the panel (H3). Anterior, to the left, and dorsal, to the top for panels a1–j1 and a2–j2. Scale bars in a1–j1 and in a3–j3 are 100 μm and 50 μm, respectively. |
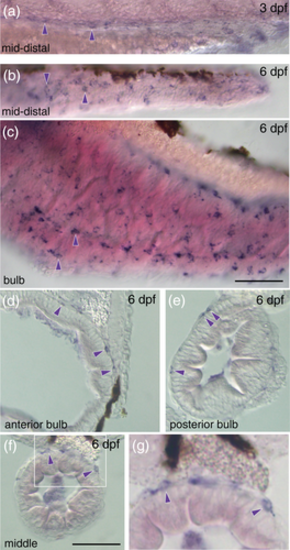
The intestinal expression of pdgfra gene at different stages. (a–c) Expression of pdgfra gene in the middle and distal part of the intestine at 3 dpf (a) and 6 dpf (b, c). Panel c shows its expression in the intestinal bulb. Skin is removed in the 6 dpf larvae for better observation. Purple signals are observed in the intestine (purple triangles). Left side views. Anterior, to the left. Stages examined are shown in the top-right corners. (d–g) Cross sections at the level of anterior part of the intestinal bulb (d), posterior part of the intestinal bulb (e), and middle part of the intestine (f). Panel g is a close-up image of the indicated area in panel f. Purple triangles indicate expression of pdgfra outside of the mucosal layer. Scale bar: 50 μm. |