|
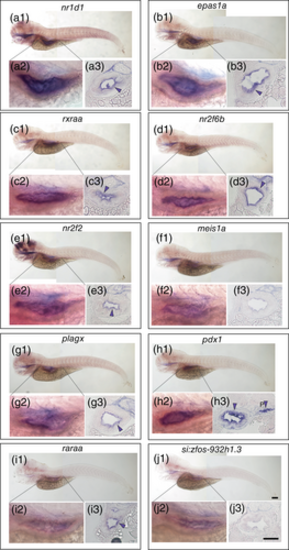
Intestinal expression patterns of transcription factors except osr2, pparg, and foxp4. For each gene, a set of three pictures is shown. Names of the genes examined are shown in the top of each rectangle. Panels a1–j1, a2–j2, and a3–j3 are left side views of entire body, close-up views of the intestinal bulb, and cross sections at the level of the intestinal bulb, respectively. Purple triangles indicate mucosal expression, while pancreas is marked by the one with “P” in the panel (H3). Anterior, to the left, and dorsal, to the top for panels a1–j1 and a2–j2. Scale bars in a1–j1 and in a3–j3 are 100 μm and 50 μm, respectively.
|