
Fig. 2
- ID
- ZDB-IMAGE-231229-8
- Genes
- Publication
- Nikaido et al., 2023 - Intestinal expression patterns of transcription factors and markers for interstitial cells in the larval zebrafish
- All Figures
- Figures for Nikaido et al., 2023
|
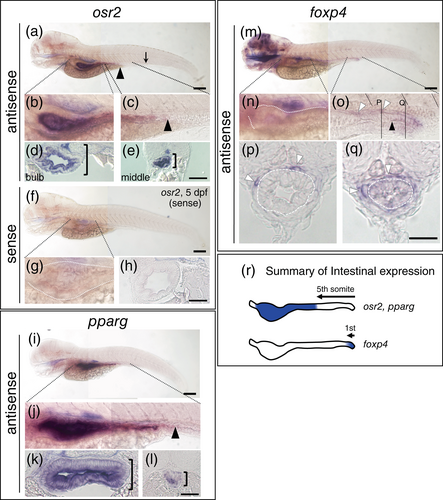
Fig. 2 Intestinal expression patterns of osr2, pparg, and foxp4. Panels a–e, f–h, i–l, and m–q are images of larvae hybridized with antisense osr2, sense osr2, antisense pparg and antisense foxp4 probes, respectively. The left side views of osr2 (a), sense osr2 (f), pparg (i) and foxp4 (m) are shown, and the close-up views (b, c for osr2; g for sense osr2; j for pparg; n, o for foxp4) correspond to indicated regions. Dorsal, to the top. Cross sections are also shown at the level of the intestinal bulb (d, h, k), middle part of the intestine (e, l) and distal part of the intestine (p, q). The stained larvae in panels d and e are different from those in panels a–c. Cross sections (p) and (q) at the indicated level in (o) show foxp4 expression in the gut epithelial cells (encircled by white dashed line) and in the cells dorsal outside of them (white triangles). The black triangles in panels a, c, and j indicate the borders of the expression domain. Black arrow in panel a show the position of cloaca. Black close square brackets indicate the position of intestinal tubes (d, e, k, l). White dotted lines outline the intestine (g, n). Black dashed line in panel o indicates somite boundary. Scale bars in panels a, f, i, and m and e, h, l, and q are 100 μm and 50 μm, respectively. (r) A summary of the intestinal expression domain of osr2, pparg, and foxp4. The end of expression domain is indicated by the somite number from the cloaca.