
- Title
-
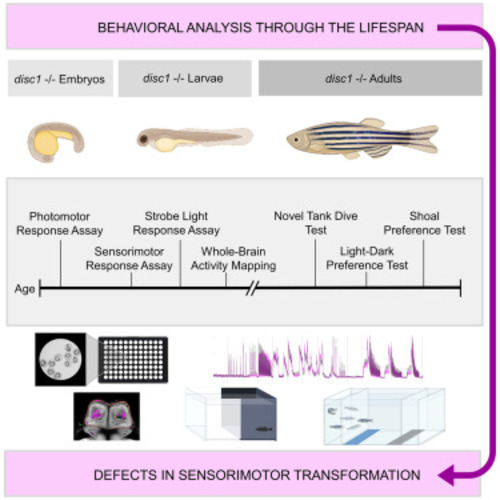
Behavioral analysis through the lifespan of disc1 mutant zebrafish identifies defects in sensorimotor transformation
- Authors
- Pluimer, B.R., Harrison, D.L., Boonyavairoje, C., Prinssen, E.P., Rogers-Evans, M., Peterson, R.T., Thyme, S.B., Nath, A.K.
- Source
- Full text @ iScience
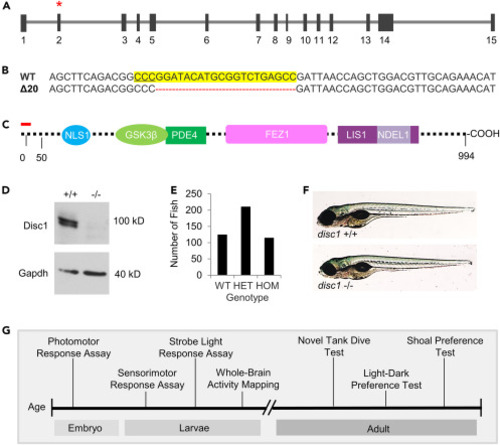
Generation of the disc1 mutant genetic model in zebrafish (A) Representation of the 15 exon disc1 gene. Red asterisk indicates the site targeted. (B) The CRISPR-Cas9 target site is highlighted in yellow, with the PAM underlined. A mutant line with a 20-base pair deletion (denoted by red dashes) was identified. (C) Depiction of the putative Disc1 protein domains. The red line indicates the predicted length of the truncated protein in disc1 mutants. (D) Western blot of Disc1 protein in lysates from disc1 WT and HOM larvae at 7 dpf (25 larvae per lane). (E) Ratio of genotypes in offspring generated by disc1 heterozygous incrosses (n = 451; age = 3 months). (F) Light micrographs of disc1 WT and HOM larvae at 7 dpf. (G) Diagram depicting the timeline of neurobehavioral assays conducted through lifespan. |
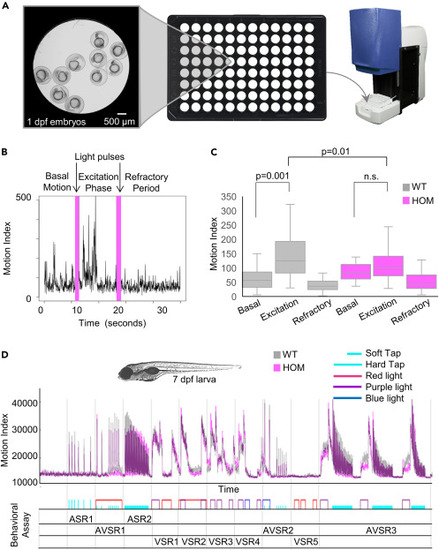
disc1 mutant embryos and larvae display blunted behavioral responses to sensory stimuli (A) Overview of the photomotor response assay: Ten embryos (28 hpf) per well were loaded into 96-well plates and motion was measured using the ZebraBox. (B) Example motion index graph. For each well, basal motion was captured, followed by an excitation period induced by a light stimulus (denoted by a magenta vertical bar), and a refractory period in which a second light stimulus (denoted by a magenta vertical bar) did not elicit motion. (C) Box and whisker plot showing motion indexes for the basal, excitation, and refractory phases in WT (gray) and mutant (magenta) embryos (n = 48 wells per genotype). The box in the plot represents the 25th percentile to the 75th percentile, the line across the box represents the median, and the whiskers are the maximum and minimum data-point values. (D) Behavioral profile generated in 7 dpf larvae using a battery of sensory and acoustic stimuli demonstrating decreased motor output in disc1 mutants in response to auditory stimuli. Plot shows the average motion index of WT (gray) and disc1 mutant (magenta) larvae (8 larvae per well, 36 wells per genotype). The x-and y axes indicate time and the motion index, respectively. Behavioral assay names and their order in the run are indicated below the x axis. AS = auditory stimulus, VS. = visual stimulus and AV = auditory plus visual stimulus. PHENOTYPE:
|
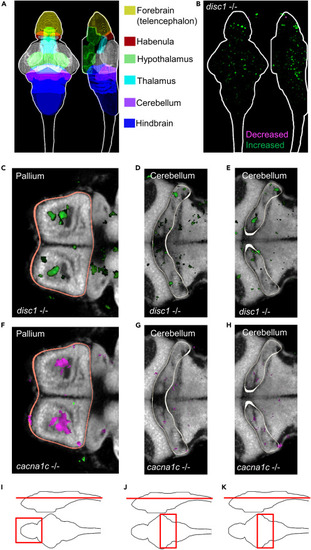
Brain-wide mapping of neural activity in disc1 mutants following acoustic stimulus (A) Color coded diagram highlighting several structures in the larval zebrafish brain at 7 dpf. (B) Sum-of-slices projections (x- and z-axes) of significant differences between disc1 mutant and sibling control groups (n = 44 HOM and n = 38 sibling controls). Increased versus decreased neuronal activity in disc1 mutants is displayed as green and magenta, respectively. (C-H) Image slices showing the specific brain subregions with significant differences in neuronal activity in (C-E) disc1 and (F-H) cacna1c mutants. Images of activity in the (C,F) pallium (outlined in orange) and (D-E), (G-H) cerebellum (outlined in white) demonstrating increased activity differences in these regions in disc1 mutants and decreased activity differences in these regions in cacna1c mutants. (I-K) Diagrams indicating the spatial location of the image slices displayed in panels C/F, D/G, and E/H, respectively. |
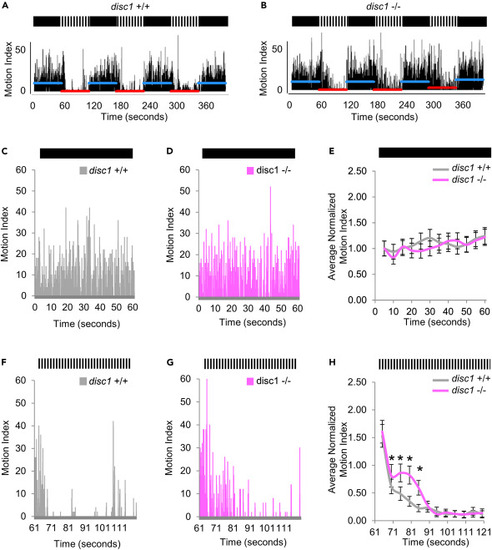
Innate fear response is abrogated in disc1 mutant larvae (A and B) Plots of motion index for (A) WT and (B) mutant larvae (7 dpf) in the strobe light response assay. Dark versus strobe light intervals are indicated by the solid black versus the black-and-white panels above the plots. (C and D) The blue and red lines indicate the average motion index during the dark and strobing light periods, respectively. Representative plots of 60 s of motion during the dark period for (C) WT and (D) mutant larvae. (E) Graph of average motion index over time (motion binned in 5 s intervals) in WT (gray) and mutant (magenta) larvae demonstrating that both move at a similarly constant level throughout the 60-s dark period (10 larvae per well, 48 wells per genotype). (F and G) Data is normalized to the WT MI at t = 0. Representative plots of motion during the strobe light period for (F) WT and (G) mutant larvae. (H) Graph of average motion index over time in WT (gray) and mutant (magenta) larvae demonstrating that, during the strobe light phase and during a specific period (t = 71-90), disc1 mutants exhibit a higher motion index as compared with WT larvae. Data is normalized to the WT MI at t = 0. ∗ = p < 0.01. Error bars = standard deviation. PHENOTYPE:
|
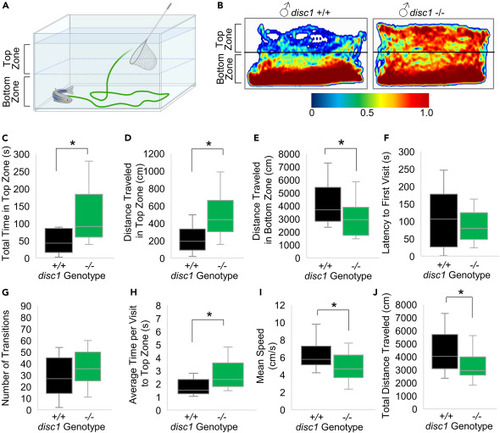
Adult male disc1 mutants exhibit decreased anxiogenic behavior and increased exploration behavior in a novel environment (A) Diagram of behavioral testing arena. (B) Spatiotemporal data (heat maps) depicting the amount of time spent at each location in the testing arena by a representative male WT sibling and male disc1 mutant (red indicates increased time and blue indicates decreased time). (C-J) Box and whisker plots of the (C) total time spent in the top zone, (D) distance traveled in the top zone, (E) distance traveled in the bottom zone, (F) latency time to first visit to the top zone, (G) the number of transitions between the top and bottom zone, (H) average time per visit in the top zone, (I) mean speed throughout the duration of the assay, and (J) total distance traveled in the top and bottom zone combined. WTs (black, n = 16 males), HOMs (green, n = 16 males). ∗ = p < 0.01. The box in the plot represents the 25th percentile to the 75th percentile, the line across the box represents the median, and the whiskers are the maximum and minimum data-point values. ∗ = p<0.05. PHENOTYPE:
|
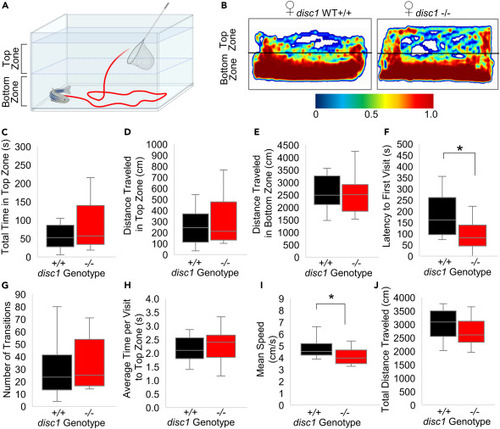
Adult female disc1 mutants do not exhibit decreased anxiogenic behavior and increased exploration behavior in a novel environment (A) Diagram of behavioral testing arena. (B) Spatiotemporal data (heat maps) depicting the amount of time spent at each location in the testing arena by a representative female WT sibling and female disc1 mutant (red indicates increased time and blue indicates decreased time). (C-J) Box and whisker plots of the (C) total time spent in the top zone, (D) distance traveled in the top zone, (E) distance traveled in the bottom zone, (F) latency time to first visit to the top zone, (G) the number of transitions between the top and bottom zone, (H) average time per visit in the top zone, (I) mean speed throughout the duration of the assay, and (J) total distance traveled in the top and bottom zone combined. WT (black, n = 16 females), mutant (red, n = 16 females). ∗ = p < 0.01. The box in the plot represents the 25th percentile to the 75th percentile, the line across the box represents the median, and the whiskers are the maximum and minimum data-point values. ∗ = p<0.05. PHENOTYPE:
|
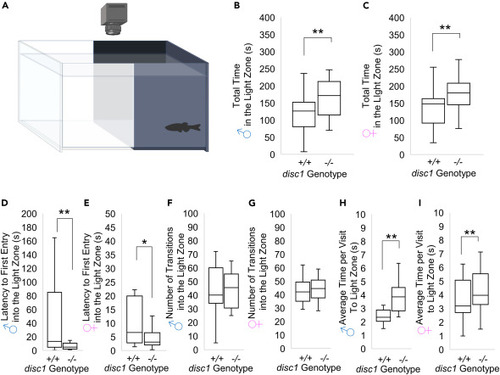
Adult disc1 mutants do not exhibit scototaxis in the light-dark preference test (A) Diagram of behavioral testing arena. (B-G) Total time spent in the light zone (open bars) and dark zone (black bars) by WT sibling and mutant (B) males (n = 16) and (C) females (n = 16). Latency to first entry into the light zone in (D) males and (E) females. Number of transitions into the light zone in (F) males and (G) females. (H and I) Average visit time in the light zone in (H) males and (I) females. ∗∗ = FDR significant, ∗ = nominally significant. Data are presented as box and whisker plots. The box in the plot represents the 25th percentile to the 75th percentile, the line across the box represents the median, and the whiskers are the maximum and minimum data-point values. PHENOTYPE:
|
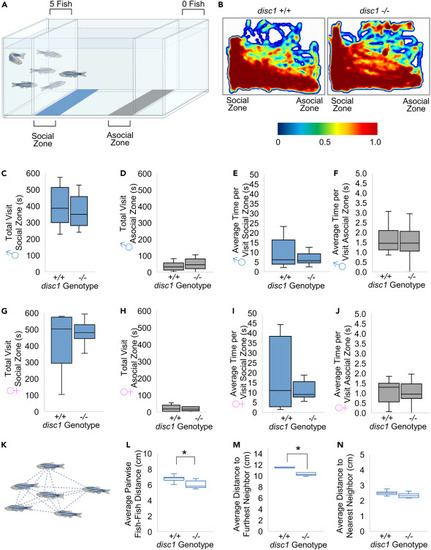
Adult disc1 mutants exhibit a preference for being part of a shoal (A) Diagram of behavioral testing arena. (B) Heat maps depicting the amount of time spent at each location in the testing arena by a representative WT sibling and disc1 mutant (red indicates increased time and blue indicates decreased time). (C-F) Total visit time to the social zone, (D) total visit time to the asocial zone, (E) average time per visit to the social zone, and (F) average time per visit to the social zone in males WTs (n = 16) and male disc1 mutants (n = 16). (G-K) Total visit time to the asocial zone, (H) total visit time to the asocial zone, (I) average time per visit to the asocial zone, and (J) average time per visit to the asocial zone in females WTs (n = 16) and female disc1 mutants (n = 16). (K) Pairwise interactions measured in the shoal cohesion assay (n = 18; 3 males and 3 females per shoal). (L-N) Average pairwise fish-fish distance, (M) average distance to the furthest neighbor, and (N) average distance to the nearest neighbor. ∗ = p < 0.01. Data are presented as box and whisker plots. The box in the plot represents the 25th percentile to the 75th percentile, the line across the box represents the median, and the whiskers are the maximum and minimum data-point values. PHENOTYPE:
|
|

Unillustrated author statements |