
|
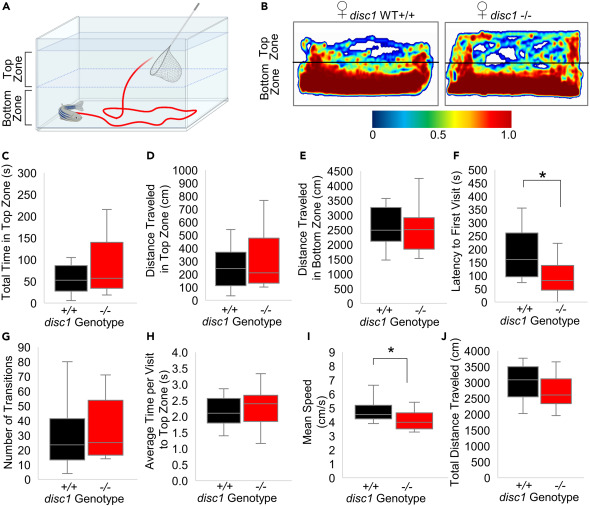
Fig. 6 Adult female disc1 mutants do not exhibit decreased anxiogenic behavior and increased exploration behavior in a novel environment (A) Diagram of behavioral testing arena. (B) Spatiotemporal data (heat maps) depicting the amount of time spent at each location in the testing arena by a representative female WT sibling and female disc1 mutant (red indicates increased time and blue indicates decreased time). (C-J) Box and whisker plots of the (C) total time spent in the top zone, (D) distance traveled in the top zone, (E) distance traveled in the bottom zone, (F) latency time to first visit to the top zone, (G) the number of transitions between the top and bottom zone, (H) average time per visit in the top zone, (I) mean speed throughout the duration of the assay, and (J) total distance traveled in the top and bottom zone combined. WT (black, n = 16 females), mutant (red, n = 16 females). ∗ = p < 0.01. The box in the plot represents the 25th percentile to the 75th percentile, the line across the box represents the median, and the whiskers are the maximum and minimum data-point values. ∗ = p<0.05.