|
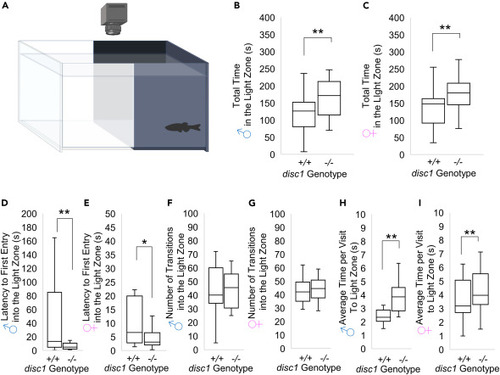
Adult disc1 mutants do not exhibit scototaxis in the light-dark preference test (A) Diagram of behavioral testing arena. (B-G) Total time spent in the light zone (open bars) and dark zone (black bars) by WT sibling and mutant (B) males (n = 16) and (C) females (n = 16). Latency to first entry into the light zone in (D) males and (E) females. Number of transitions into the light zone in (F) males and (G) females. (H and I) Average visit time in the light zone in (H) males and (I) females. ∗∗ = FDR significant, ∗ = nominally significant. Data are presented as box and whisker plots. The box in the plot represents the 25th percentile to the 75th percentile, the line across the box represents the median, and the whiskers are the maximum and minimum data-point values.
|