
|
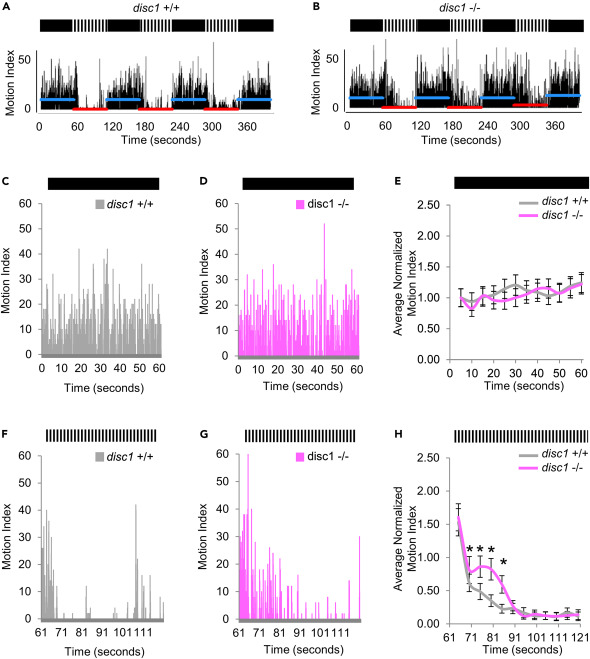
Fig. 4 Innate fear response is abrogated in disc1 mutant larvae (A and B) Plots of motion index for (A) WT and (B) mutant larvae (7 dpf) in the strobe light response assay. Dark versus strobe light intervals are indicated by the solid black versus the black-and-white panels above the plots. (C and D) The blue and red lines indicate the average motion index during the dark and strobing light periods, respectively. Representative plots of 60 s of motion during the dark period for (C) WT and (D) mutant larvae. (E) Graph of average motion index over time (motion binned in 5 s intervals) in WT (gray) and mutant (magenta) larvae demonstrating that both move at a similarly constant level throughout the 60-s dark period (10 larvae per well, 48 wells per genotype). (F and G) Data is normalized to the WT MI at t = 0. Representative plots of motion during the strobe light period for (F) WT and (G) mutant larvae. (H) Graph of average motion index over time in WT (gray) and mutant (magenta) larvae demonstrating that, during the strobe light phase and during a specific period (t = 71-90), disc1 mutants exhibit a higher motion index as compared with WT larvae. Data is normalized to the WT MI at t = 0. ∗ = p < 0.01. Error bars = standard deviation.