
|
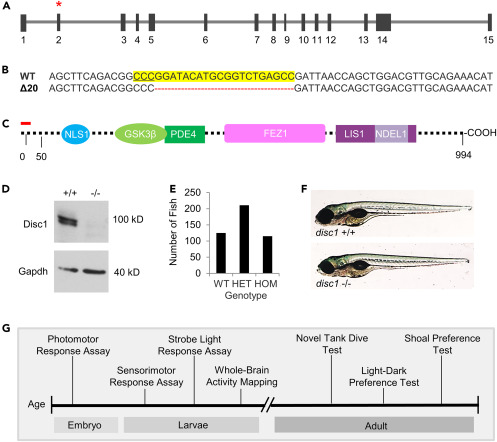
Fig. 1 Generation of the disc1 mutant genetic model in zebrafish (A) Representation of the 15 exon disc1 gene. Red asterisk indicates the site targeted. (B) The CRISPR-Cas9 target site is highlighted in yellow, with the PAM underlined. A mutant line with a 20-base pair deletion (denoted by red dashes) was identified. (C) Depiction of the putative Disc1 protein domains. The red line indicates the predicted length of the truncated protein in disc1 mutants. (D) Western blot of Disc1 protein in lysates from disc1 WT and HOM larvae at 7 dpf (25 larvae per lane). (E) Ratio of genotypes in offspring generated by disc1 heterozygous incrosses (n = 451; age = 3 months). (F) Light micrographs of disc1 WT and HOM larvae at 7 dpf. (G) Diagram depicting the timeline of neurobehavioral assays conducted through lifespan.