
- Title
-
Mesodermal FGF and BMP govern the sequential stages of zebrafish thyroid specification
- Authors
- Haerlingen, B., Opitz, R., Vandernoot, I., Molinaro, A., Shankar, M.P., Gillotay, P., Trubiroha, A., Costagliola, S.
- Source
- Full text @ Development
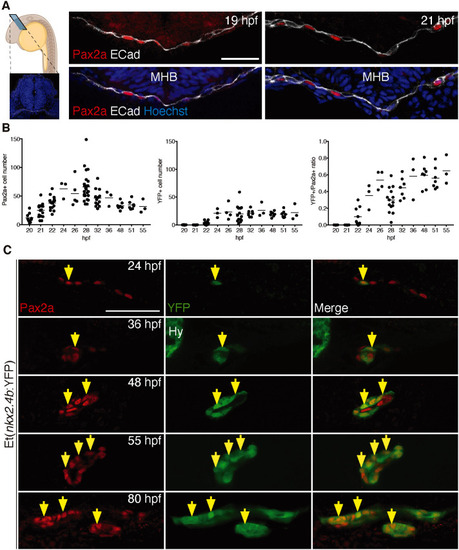
Sequential induction of thyroid transcription factors in foregut endoderm. (A) Panel on the left shows a schematic of a zebrafish embryo depicting the sectioning plane and a cross-section highlighting the anatomical organization of the region analyzed; E-cadherin (Cadherin 1; white) labels epithelia and DAPI (blue) cell nuclei. Panels on the right show Pax2a expression in anterior foregut endoderm (labeled with E-cadherin) before thyroid anlage formation. Confocal images of cross-sections at the level of the MHB are shown. (B) Total number of foregut endodermal cells expressing Pax2a (left) and YFP (middle) in Et(nkx2.4b:YFP) embryos and proportion of Pax2a+/YFP+ cells within the Pax2a+ cell population (right). Values determined in individual embryos (dots) and mean values (bars) are shown. (C) Pax2a and YFP expression in thyroid region of Et(nkx2.4b:YFP) embryos. Confocal images of sagittal (24-55 hpf) and coronal sections (80 hpf) are shown with arrows marking selected cells co-expressing Pax2a and YFP. Anterior is to the left. Hy, YFP expression in hypothalamus. Scale bars: 25 µm. |
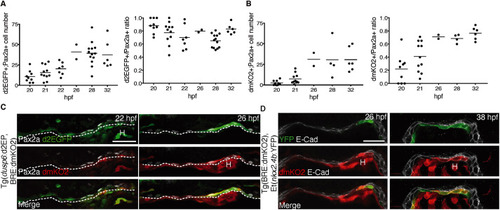
Sequential appearance of FGF and BMP signaling in Pax2-expressing endoderm. (A) FGF signaling reporter expression. Left: Total number of Pax2a+/d2GFP+ cells in foregut endoderm of Tg(dusp6:d2EGFP) embryos. Right: Relative abundance of Pax2a+/d2GFP+ cells in the Pax2a+ cell population. Values determined in individual embryos (dots) and mean values (bars) are shown. (B) BMP signaling reporter expression. Left: Total number of Pax2a+/dmKO2+ cells in foregut endoderm of Tg(BRE:dmKO2) embryos. Right: Relative abundance of Pax2a+/dmKO2+ cells in the Pax2a+ cell population. (C) Pax2a, d2GFP and dmKO2 expression in thyroid region of Tg(dusp6:d2EGFP;BRE:dmKO2) double-transgenic embryos. Confocal images of transverse sections. Dashed line marks border between endoderm and ventral foregut mesenchyme. (D) IF of E-cadherin (E-Cad), dmKO2 and YFP expression in thyroid region of Tg(BRE:dmKO2);Et(nkx2.4b:YFP) double-transgenic embryos. Confocal images of transverse sections. Note that YFP expression is restricted to endodermal cells expressing the BMP signaling reporter dmKO2. H, heart. Scale bars: 25 µm. |
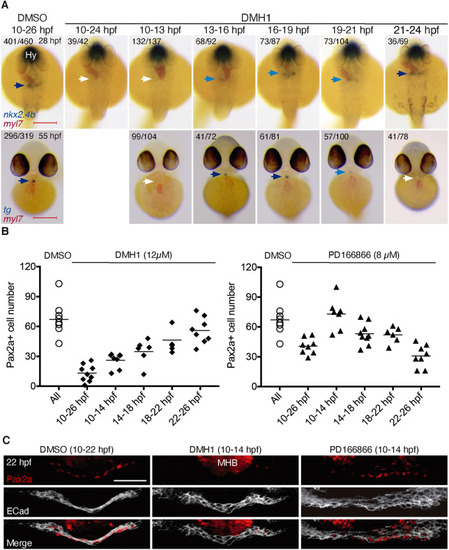
Effects of timed inhibition of BMP and FGF signaling on thyroid specification. (A) Major thyroid phenotypes recovered following DMH1 treatment during the indicated periods. Thyroid development was assessed by in situ hybridization of nkx2.4b at 28 hpf (dorsal views, anterior to the top) and tg at 55 hpf (ventral views, anterior to the top). Co-staining with myl7 riboprobe shows localization of cardiac tissue. Numbers indicate the proportion of embryos with the represented phenotype out of the total number of observed embryos. Arrows point to thyroid tissue (colors highlight different levels of repression of thyroid marker expression). Hy, hypothalamus. Scale bars: 200 µm. (B) Quantification of the number of Pax2a+ cells in foregut endoderm of 28 hpf embryos following treatment with DMH1 or PD166866. Treatment intervals are indicated on the x-axis. DMSO (0.1%) treatment served as vehicle control group. Values obtained in individual embryos are shown and bars depict mean values for each experimental group. Values of the control group represent pooled control data from the various treatment periods. (C) Three-dimensional reconstruction of Pax2a expression domain in foregut of 22 hpf embryos treated with inhibitors of FGF (8 µM PD166866) or BMP signaling (12 µM DMH1) between 10 and 14 hpf. Confocal images of transverse sections are shown. E-cadherin (ECad) labels foregut epithelium. Note the complete loss of Pax2a expression in response to DMH1 treatment. Scale bar: 25 µm. |
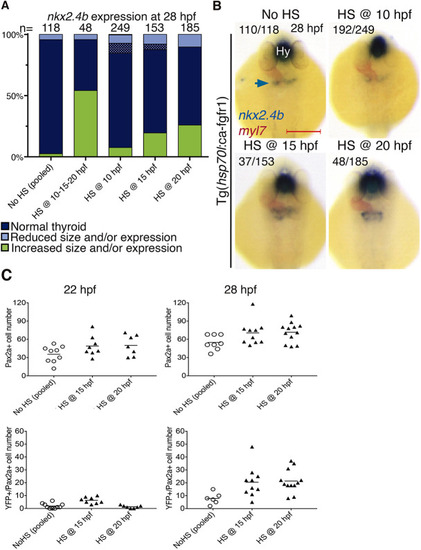
Enhanced FGF signaling during late somitogenesis promotes thyroid precursor specification. (A) Distribution of thyroid phenotypes (nkx2.4b expression at 28 hpf) induced by overactivation of FGF signaling using HS treatment of Tg(hsp70l:ca-fgfr1) embryos at the indicated time points. Phenotypic data shown include carriers and non-carriers of the HS-inducible transgene. Cases with abnormal morphology/positioning of nkx2.4b expression domain are highlighted by dotted texture overlays. (B) Thyroid phenotypes recovered at 28 hpf by in situ hybridization of nkx2.4b and myl7 (cardiomyocytes) following overactivation of FGF signaling at the indicated time points. Arrow points to the thyroid anlage. Numbers indicate the proportion of embryos with the represented phenotype out of the total number of observed embryos and include carriers and non-carriers of the HS-inducible transgene. Dorsal views, anterior to the top. Hy, hypothalamus. Scale bar: 200 µm. (C) Total number of foregut endoderm cells expressing Pax2a (top) and cells expressing both Pax2a and YFP (bottom) following HS treatment of Tg(hsp70l:ca-fgfr1);Et(nkx2.4b:YFP) double-transgenic embryos at the indicated time points. Values for individual embryos and mean values (bars) are shown. Data shown include carriers and non-carriers of the HS-inducible transgene. |
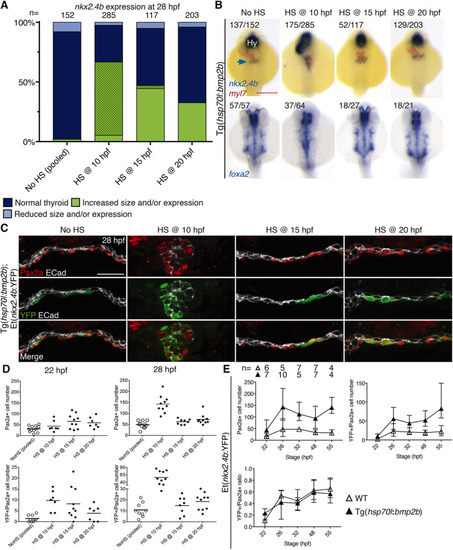
Enhanced BMP signaling promotes thyroid precursor specification. (A) Distribution of thyroid phenotypes (nkx2.4b expression at 28 hpf) induced by overactivation of BMP signaling using HS treatment of Tg(hsp70l:bmp2b) embryos at the indicated time points. Phenotypic data shown include carriers and non-carriers of the HS-inducible transgene. Cases with abnormal morphology/positioning of nkx2.4b expression domain are highlighted by dotted overlays. (B) Thyroid and endodermal phenotypes recovered at 28 hpf by in situ hybridization of nkx2.4b, myl7 (cardiomyocytes) and foxa2 (foregut endoderm) following overactivation of BMP signaling at the indicated time points. Numbers indicate the proportion of embryos with the phenotype shown out of the total number of embryos observed and include carriers and non-carriers of the HS-inducible transgene. Arrow points to the thyroid anlage. Dorsal views, anterior to the top. Hy, hypothalamus. Scale bar: 200 µm. (C) Pax2a, YFP and E-cadherin (ECad) expression in foregut endoderm of Tg(hsp70l:bmp2b);Et(nkx2.4b:YFP) double-transgenic embryos at 28 hpf. Confocal images of transverse sections are shown. Note the severely perturbed morphology (rod-like) of the foregut following HS treatment at 10 hpf. Scale bar: 25 µm. (D) Total number of foregut cells expressing Pax2a (top) and cells expressing both Pax2a and YFP (bottom) following HS treatment of Tg(hsp70l:bmp2b);Et(nkx2.4b:YFP) double-transgenic embryos at the indicated time points. Values for individual embryos and mean values (bars) are shown. Data for HS at 10 hpf are from ventralized embryos (carriers of the HS transgene). Data for HS treatments at 15 and 20 hpf include carriers and non-carriers of the HS-inducible transgene. (E) Temporal analyses of thyroid markers in Tg(hsp70l:bmp2b);Et(nkx2.4b:YFP) embryos heat-shocked at 10 hpf. Carriers of the HS transgene were identified based on their unique ventralized body morphology. Total number of foregut cells expressing Pax2a (top left) and cells expressing both Pax2a and YFP (top right) are shown for the indicated time points. Bottom graph shows the percentage of Pax2a cells co-expressing YPF. Mean±s.d. is shown. |
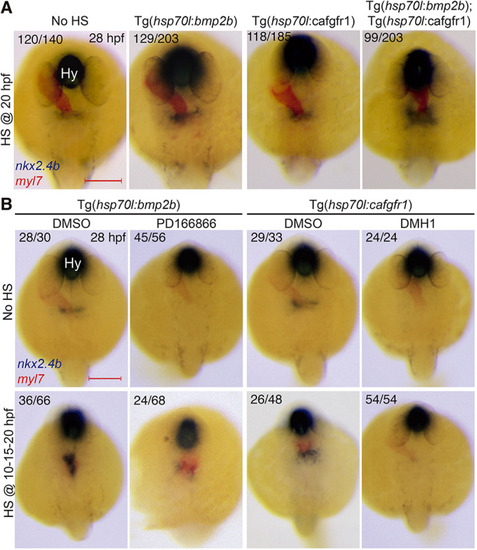
Cooperative effects of FGF and BMP on thyroid specification. (A) Representative thyroid phenotypes recovered at 28 hpf by in situ hybridization of nkx2.4b and myl7 (cardiomyocytes) following HS treatment of double-transgenic Tg(hsp70l:bmp2b;hsp70l:ca-fgfr1) embryos at 20 hpf. Carriers of the individual transgenes were identified by genotyping. Note the expansion of the thyroidal nkx2.4b expression domain in embryos with concurrent overactivation of both pathways. (B) Top: Thyroid phenotypes recovered at 28 hpf after inhibition of FGF (8 µM PD166866) and BMP signaling (12 µM DMH1) from 10 to 24 hpf. Bottom: Rescue efficacy by concurrent overactivation of BMP or FGF signaling (repeated HS at 10, 15 and 20 hpf). Note that overactivation of BMP signaling could partially restore nkx2.4b expression in embryos treated with FGF inhibitor. Numbers indicate the proportion of embryos with the represented phenotype out of the total number of observed embryos and include carriers and non-carriers of the HS-inducible transgene. Dorsal views, anterior to the top. Hy, hypothalamus. Scale bars: 200 µm. |
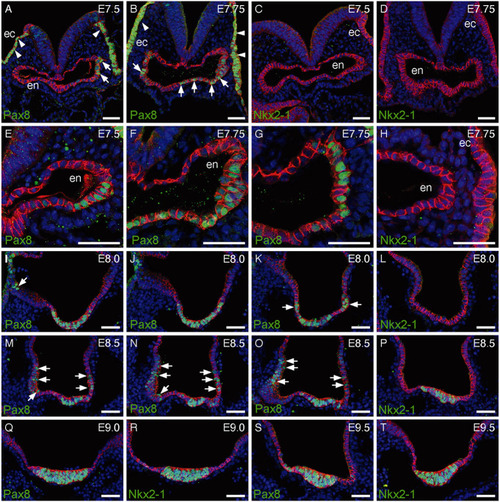
Pax8 and Nkx2-1 expression during mouse foregut morphogenesis. (A-D) IF staining of E7.5 and E7.75 embryos at the level of the forming foregut pocket shows strong Pax8 expression in the non-neuronal, ectodermal epithelium (ec, arrowheads) and in epithelial cells of the foregut endoderm (en, arrows). These embryos had a TS12 morphology and Nkx2-1 expression was not detectable at this stage. E-cadherin (cadherin 1) staining (red) is used to label epithelial structures in all panels. (E-H) Higher magnification views of foregut endoderm in E7.5-E7.75 embryos illustrate variable levels of Pax8 staining in endodermal cells (F). Confocal z-sections acquired at 50 µm intervals along the AP axis show anterior Pax8 expression (F) in both ventral and lateral foregut endoderm whereas posterior Pax8 expression (G) is limited to lateral endoderm. Note the complete absence of Nkx2-1 expression (H). (I-K) Confocal z-sections acquired at 30 µm intervals along the AP axis of E8.0 embryo foregut illustrate how the broad Pax8 expression domain in anterior ventral foregut endoderm (I) expands to gradually include more lateral domains at posterior locations (arrows in K). This embryo had a TS13 morphology. (L) Nkx2-1 expression was not detectable in E8.0 embryos. (M-P) Upon completion of embryo turning at E8.5, expression of both Pax8 (M-O) and Nkx2-1 (P) is detectable in ventral foregut endoderm of TS14 embryos. Confocal z-sections acquired at different levels along the AP axis show widespread persistence of Pax8 expression in the lateral foregut epithelium (arrows in M-O). (Q-T) Co-expression of Pax8 and Nkx2-1 in the morphologically distinct, ventral midline primordium of the thyroid of E9.0 (Q,R) and E9.5 (S,T) embryos. Scale bars: 50 µm. |
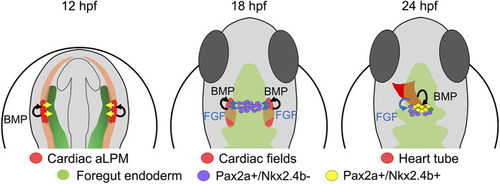
Refined model of thyroid precursor specification. During early somitogenesis, the anterior foregut endoderm (green) receives patterning signals (yellow arrows) from the anterior lateral plate mesoderm (aLPM). At around 18 hpf, FGF signals (blue arrows) derived from the adjacent cardiac mesoderm (red) induce Pax2a expression in endodermal cells. Up to this stage, active BMP signaling is limited to mesodermal cells. Around 23/24 hpf, a subpopulation of Pax2a+ endodermal cells, located closest to the cardiac outflow tract mesoderm, receives BMP signals inducing Nkx2.4b expression. Pax2a+/Nkx2.4b+ cells represent committed thyroid cell precursors, whereas Pax2a+/Nkx2.4b− cells assume alternative cell fates. |