
|
Fig. 2.
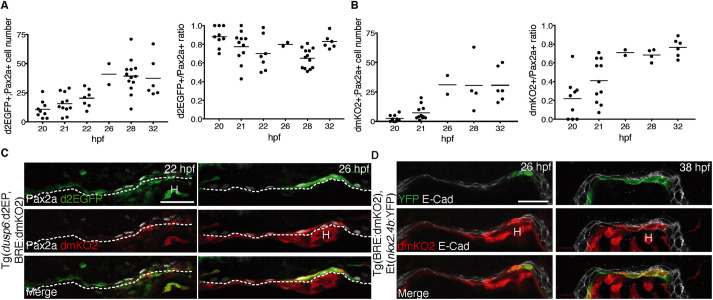
Sequential appearance of FGF and BMP signaling in Pax2-expressing endoderm. (A) FGF signaling reporter expression. Left: Total number of Pax2a+/d2GFP+ cells in foregut endoderm of Tg(dusp6:d2EGFP) embryos. Right: Relative abundance of Pax2a+/d2GFP+ cells in the Pax2a+ cell population. Values determined in individual embryos (dots) and mean values (bars) are shown. (B) BMP signaling reporter expression. Left: Total number of Pax2a+/dmKO2+ cells in foregut endoderm of Tg(BRE:dmKO2) embryos. Right: Relative abundance of Pax2a+/dmKO2+ cells in the Pax2a+ cell population. (C) Pax2a, d2GFP and dmKO2 expression in thyroid region of Tg(dusp6:d2EGFP;BRE:dmKO2) double-transgenic embryos. Confocal images of transverse sections. Dashed line marks border between endoderm and ventral foregut mesenchyme. (D) IF of E-cadherin (E-Cad), dmKO2 and YFP expression in thyroid region of Tg(BRE:dmKO2);Et(nkx2.4b:YFP) double-transgenic embryos. Confocal images of transverse sections. Note that YFP expression is restricted to endodermal cells expressing the BMP signaling reporter dmKO2. H, heart. Scale bars: 25 µm.