
|
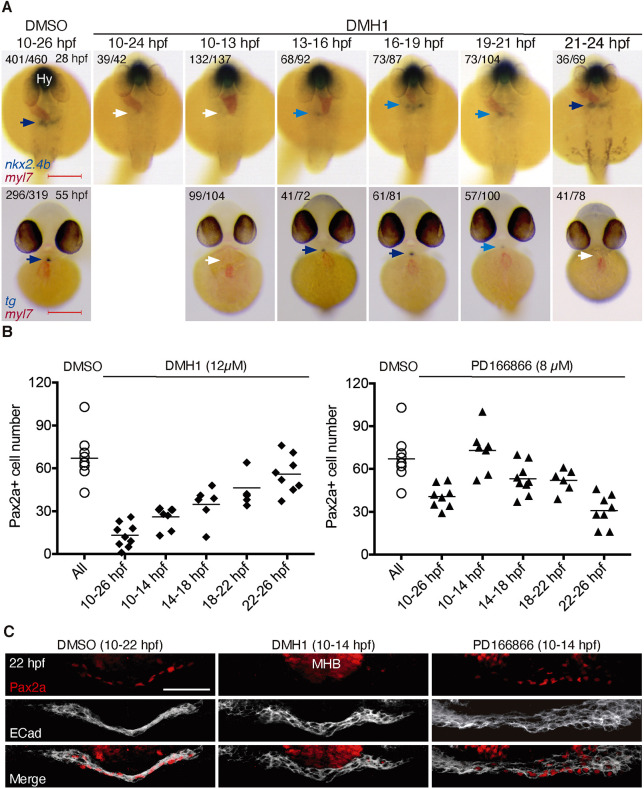
Fig. 3.
Effects of timed inhibition of BMP and FGF signaling on thyroid specification. (A) Major thyroid phenotypes recovered following DMH1 treatment during the indicated periods. Thyroid development was assessed by in situ hybridization of nkx2.4b at 28 hpf (dorsal views, anterior to the top) and tg at 55 hpf (ventral views, anterior to the top). Co-staining with myl7 riboprobe shows localization of cardiac tissue. Numbers indicate the proportion of embryos with the represented phenotype out of the total number of observed embryos. Arrows point to thyroid tissue (colors highlight different levels of repression of thyroid marker expression). Hy, hypothalamus. Scale bars: 200 µm. (B) Quantification of the number of Pax2a+ cells in foregut endoderm of 28 hpf embryos following treatment with DMH1 or PD166866. Treatment intervals are indicated on the x-axis. DMSO (0.1%) treatment served as vehicle control group. Values obtained in individual embryos are shown and bars depict mean values for each experimental group. Values of the control group represent pooled control data from the various treatment periods. (C) Three-dimensional reconstruction of Pax2a expression domain in foregut of 22 hpf embryos treated with inhibitors of FGF (8 µM PD166866) or BMP signaling (12 µM DMH1) between 10 and 14 hpf. Confocal images of transverse sections are shown. E-cadherin (ECad) labels foregut epithelium. Note the complete loss of Pax2a expression in response to DMH1 treatment. Scale bar: 25 µm.