
Fig. 5.
- ID
- ZDB-FIG-230529-33
- Publication
- Haerlingen et al., 2023 - Mesodermal FGF and BMP govern the sequential stages of zebrafish thyroid specification
- Other Figures
- All Figure Page
- Back to All Figure Page
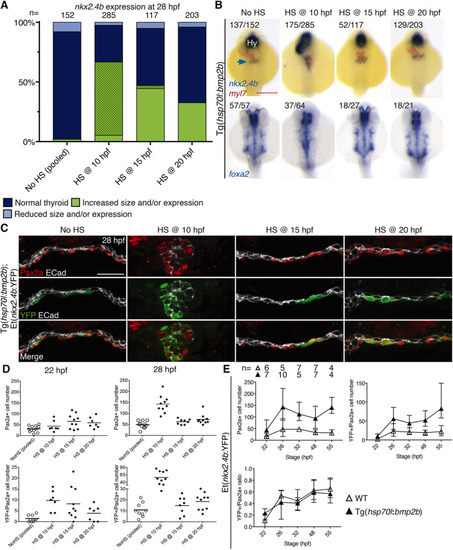
Enhanced BMP signaling promotes thyroid precursor specification. (A) Distribution of thyroid phenotypes (nkx2.4b expression at 28 hpf) induced by overactivation of BMP signaling using HS treatment of Tg(hsp70l:bmp2b) embryos at the indicated time points. Phenotypic data shown include carriers and non-carriers of the HS-inducible transgene. Cases with abnormal morphology/positioning of nkx2.4b expression domain are highlighted by dotted overlays. (B) Thyroid and endodermal phenotypes recovered at 28 hpf by in situ hybridization of nkx2.4b, myl7 (cardiomyocytes) and foxa2 (foregut endoderm) following overactivation of BMP signaling at the indicated time points. Numbers indicate the proportion of embryos with the phenotype shown out of the total number of embryos observed and include carriers and non-carriers of the HS-inducible transgene. Arrow points to the thyroid anlage. Dorsal views, anterior to the top. Hy, hypothalamus. Scale bar: 200 µm. (C) Pax2a, YFP and E-cadherin (ECad) expression in foregut endoderm of Tg(hsp70l:bmp2b);Et(nkx2.4b:YFP) double-transgenic embryos at 28 hpf. Confocal images of transverse sections are shown. Note the severely perturbed morphology (rod-like) of the foregut following HS treatment at 10 hpf. Scale bar: 25 µm. (D) Total number of foregut cells expressing Pax2a (top) and cells expressing both Pax2a and YFP (bottom) following HS treatment of Tg(hsp70l:bmp2b);Et(nkx2.4b:YFP) double-transgenic embryos at the indicated time points. Values for individual embryos and mean values (bars) are shown. Data for HS at 10 hpf are from ventralized embryos (carriers of the HS transgene). Data for HS treatments at 15 and 20 hpf include carriers and non-carriers of the HS-inducible transgene. (E) Temporal analyses of thyroid markers in Tg(hsp70l:bmp2b);Et(nkx2.4b:YFP) embryos heat-shocked at 10 hpf. Carriers of the HS transgene were identified based on their unique ventralized body morphology. Total number of foregut cells expressing Pax2a (top left) and cells expressing both Pax2a and YFP (top right) are shown for the indicated time points. Bottom graph shows the percentage of Pax2a cells co-expressing YPF. Mean±s.d. is shown. |