
|
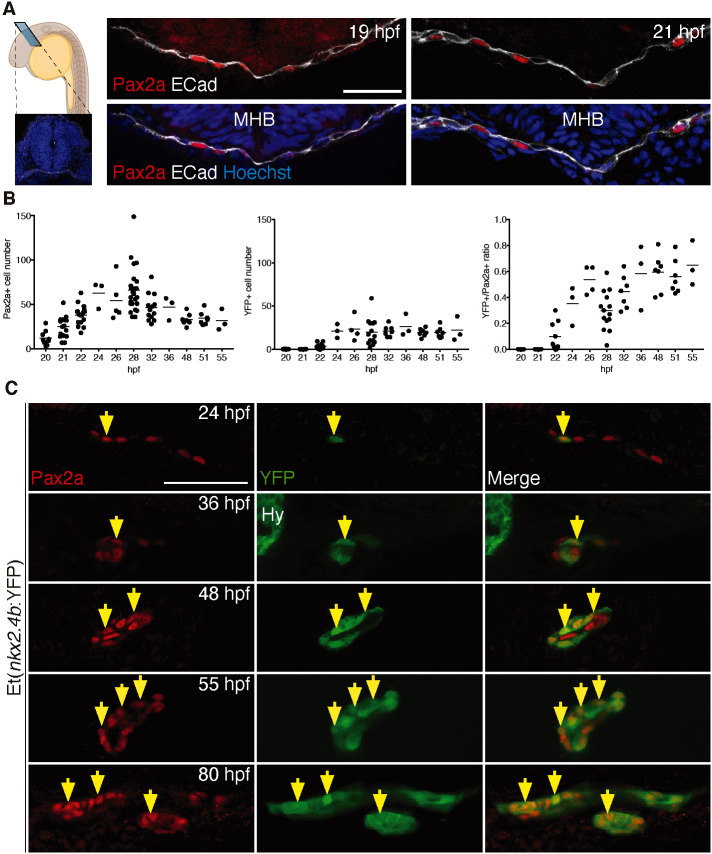
Fig. 1.
Sequential induction of thyroid transcription factors in foregut endoderm. (A) Panel on the left shows a schematic of a zebrafish embryo depicting the sectioning plane and a cross-section highlighting the anatomical organization of the region analyzed; E-cadherin (Cadherin 1; white) labels epithelia and DAPI (blue) cell nuclei. Panels on the right show Pax2a expression in anterior foregut endoderm (labeled with E-cadherin) before thyroid anlage formation. Confocal images of cross-sections at the level of the MHB are shown. (B) Total number of foregut endodermal cells expressing Pax2a (left) and YFP (middle) in Et(nkx2.4b:YFP) embryos and proportion of Pax2a+/YFP+ cells within the Pax2a+ cell population (right). Values determined in individual embryos (dots) and mean values (bars) are shown. (C) Pax2a and YFP expression in thyroid region of Et(nkx2.4b:YFP) embryos. Confocal images of sagittal (24-55 hpf) and coronal sections (80 hpf) are shown with arrows marking selected cells co-expressing Pax2a and YFP. Anterior is to the left. Hy, YFP expression in hypothalamus. Scale bars: 25 µm.