
- Title
-
Combined Inhibition of Hedgehog and HDAC6: In Vitro and In Vivo Studies Reveal a New Role for Lysosomal Stress in Reducing Glioblastoma Cell Viability
- Authors
- Pezzotta, A., Brioschi, L., Carbone, S., Mazzoleni, B., Bontempi, V., Monastra, F., Mauri, L., Marozzi, A., Mione, M., Pistocchi, A., Viani, P.
- Source
- Full text @ Int. J. Mol. Sci.
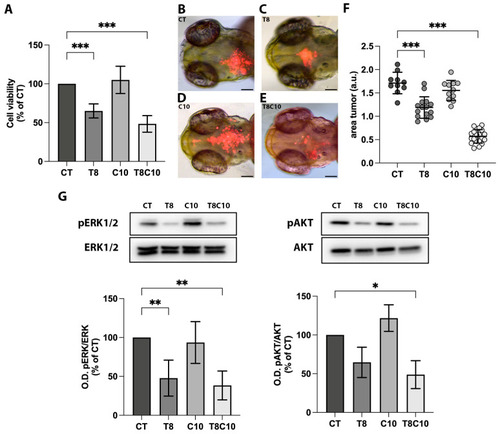
Hh and HDAC6 inhibition impaired U87-MG cell viability. (A) MTT assay of U87-MG cells treated for 48 h with vehicle (CT), 8 μM of TubA (T8), 10 μM of cyclo (C10) and 8 μM of TubA + 10 μM cyclo (T8C10). (B–E) Representative images of the head region of 3 dpf zebrafish embryos xenotransplanted with labeled U87-MG cells pretreated with (B) CT, (C) T8, (D) C10, and (E) T8C10. (F) Quantification of the tumor area at t1 (24 h postinjection, hpi) normalized to the tumor area at t0 (immediately after U87 injection). (G) Western blot analyses and quantification of pERK and pAKT protein expression levels following 48 h treatments with or without T8 and C10, alone or in combination. Data are expressed as the percentage of the control (A,G) or mean ± standard deviation (F). CT—vehicle; TubA/T—tubastatin A; cyclo/C—cyclopamine. One-way ANOVA with Tukey post hoc correction. *** p < 0.001; ** p < 0.01; * p < 0.05; nonsignificant data are not shown. Scale bare indicates 100 μm. |
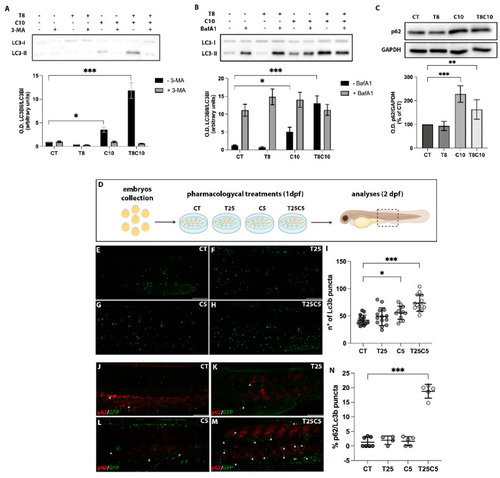
Autophagy was impaired following combination treatments with inhibitors of HDAC6 and Hh pathway in U87-MG cells and zebrafish embryos. (A,B) Western blot analysis and quantification of LC3 protein expression levels after treatments with 8 μM of TubA (T8), 10 μM of cyclo (C10), and 8 μM of TubA + 10 μM of cyclo (T8C10) in the presence (grey)/absence (black) of (A) 3-MA or (B) BafA1. (C) Western blot analysis and quantification of p62/SQSTM1 protein expression following 48 h treatments with or without T8 and C10, alone or in combination (T8C10). Data are expressed as the percentage of the control. (D) Schematic representation of the pharmacological treatments. (E–H) Confocal images of the trunk region of the Tg(CMV:eGFPmap1Lc3b) zebrafish embryos at 2 dpf after treatment with (E) DMSO, (F) 25 μM of TubA (T25), (G) 5 μM of cyclo (C5), and (H) 25 μM of TubA + 5 μM cyclo (T25C5). (I) Count of Lc3b puncta (green puncta) in the trunk region of treated embryos. (J–M) Confocal images of the trunk region of the Tg(CMV:eGFPmap1Lc3b) zebrafish embryos at 2 dpf stained with p62 antibody after treatment with (J) DMSO, (K) T25, (L) C5, and (M) T25C5. (N) Percentage of Lc3b/p62 puncta in the trunk region of treated embryos. Asterisks indicate the colocalization. Scale bar indicates 100 μm. CT—vehicle; TubA/T—tubastatin A; cyclo/C—cyclopamine. One-way ANOVA with Tukey post hoc test. Data are presented as mean ± standard deviation *** p < 0.001; ** p < 0.01; * p < 0.05. |
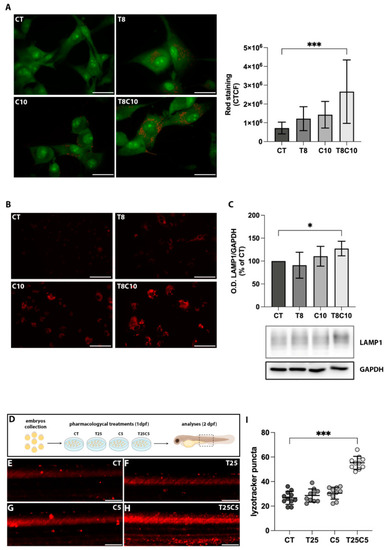
Combined HDAC6 and Hh inhibition altered acidic compartments. (A) U87-MG cells treated with vehicle (CT), 8 μM of TubA (T8), 10 μM of cyclo (C10), and 8 μM of TubA +10 μM cyclo (T8C10) for 48 h and stained with acridine orange. The AO accumulation into acidic compartments is represented by red dots. Green fluorescence arose from AO binding to DNA and RNA (B). Quantitative analysis of red fluorescence was calculated as corrected total cell fluorescence (CTCF) ± standard deviation. (C) LysoTracker Red staining in U87-MG cells treated with or without T8, C10, or T8C10. (D) Western blot analysis of LAMP1 protein expression normalized against GAPDH. Data are expressed as the percentage of the CT. (E) Schematic description of the pharmacological treatments in zebrafish. (F–I) Representative images of the trunk region of zebrafish embryos treated with 25 μM of TubA (T25) or 5 μM of cyclo (C5), alone or in combination, and stained with LysoTracker Red. (I) Quantification of the LysoTracker Red intensity in the trunk region of treated embryos. Scale bar indicates 40 μm (A) and 100 μm (B,E–H). Data are presented as mean ± standard deviation. CT—vehicle; TubA/T—tubastatin A; cyclo/C—cyclopamine. One-way ANOVA with Tukey post hoc correction. *** p < 0.001; * p < 0.05; nonsignificant data are not shown. |
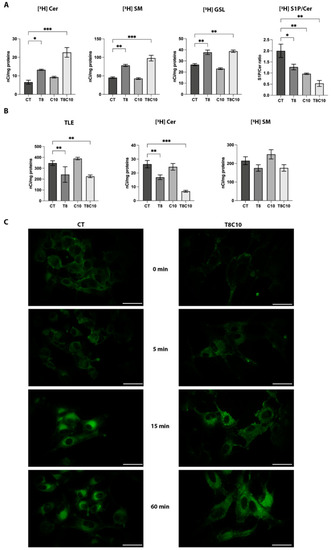
Sphingolipid metabolism and distribution were impaired following Hh and HDAC6 inhibition. (A) Radioactivity distribution among different sphingolipids after [1-3H]sphingosine administration at the metabolic steady state in U87-MG cells untreated (controls, CT) or treated with 8 μM of TubA (T8), 10 μM of cyclo (C10), and 8 μM of TubA + 10 μM cyclo (T8C10). Data are presented as mean of nCi/mg protein ± standard deviation. (B) Radioactivity of the total lipid extract (TLE), ceramide (Cer), and sphingomyelin (SM) following 2 h of [3H]SM administration in U87-MG cells CT or treated with T8, C10, or T8C10. Data are presented as mean of nCi/mg protein ± standard deviation. (C) Uptake and subcellular localization of fluorescent BODIPY-SM after treatment in U87-MG cells treated with or without T8C10 at 0 min, 5 min, 15 min, and 60 min. CT—vehicle; TubA/T—tubastatin A; cyclo/C—cyclopamine. One-way ANOVA with Tukey post hoc correction. *** p < 0.001; ** p < 0.01; * p < 0.05; nonsignificant data are not shown. Scale bar indicates 40 μm. |
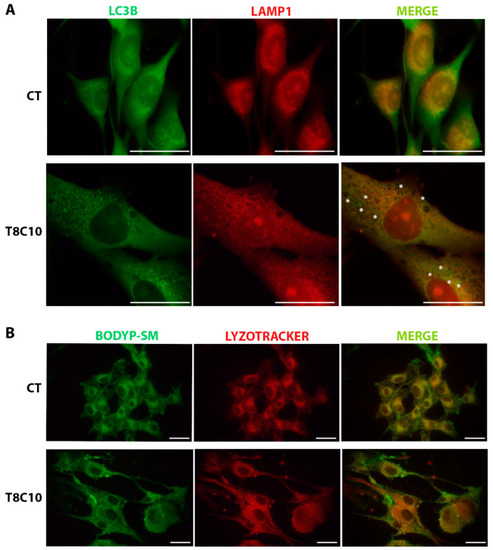
LC3 and LAMP1 colocalization and BODIPY-SM distribution were impaired following Hh and HDAC6 inhibition. (A) Double immunostaining against LC3 and LAMP1 of U87-MG cells treated in the presence or absence of both 8 μM of TubA and 10 μM of cyclo. Asterisks show some LC3 puncta, indicating autophagosomes, that did not colocalize with the red ones, indicating lysosomes. (B) BODIPY-SM and LysoTracker Red DND-99 staining of U87-MG cells treated in the presence or absence of both 8 μM of TubA and 10 μM of cyclo. CT—control, TubA/T—tubastatin A; cyclo/C—cyclopamine. Scale bar indicates 40 μm. |
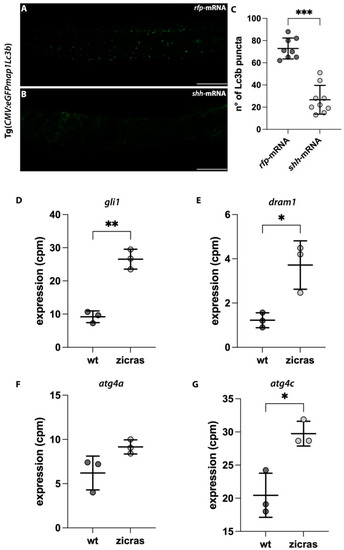
Impairment of the autophagic process in the zebrafish model with Hh hyper activation and in the zicras mutants. (A,B) Confocal images of the trunk-tail region of Tg(CMV:eGFPmap1Lc3b) embryos injected with (A) rfp-mRNA or (B) shh mRNA. (C) Count of the Lc3b puncta of rfp- and shh-mRNA injected embryos. Scale bar indicates 100 μm. (D–G) Expression analyses of (D) gli1 and genes involved in autophagy activation, including (E) dram1; (F) atg4a, and (G) atg4c, derived from the analyses of wild-type and zicras (tumor) zebrafish brains (GSE74754). Data are presented as mean ± standard deviation. cpm—counts per million. Unpaired t-test with Welch correction. *** p < 0.001; ** p < 0.01; * p < 0.05. Scale bar indicates 100 μm. |
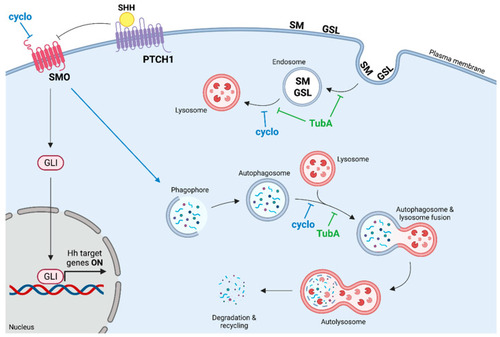
Mechanism of action of TubA and cyclo. The path of cyclo is indicated in blue while that of TubA is indicated in green. cyclo: cyclopamine; TubA: tubastatin A. SMO: smoothened; PTCH1: Ptached1; GLI: glioma-associated oncogene. SM: sphingomyelin, GSL: glycosphingolipid. Image generated with the BioRender.com tool. |