
|
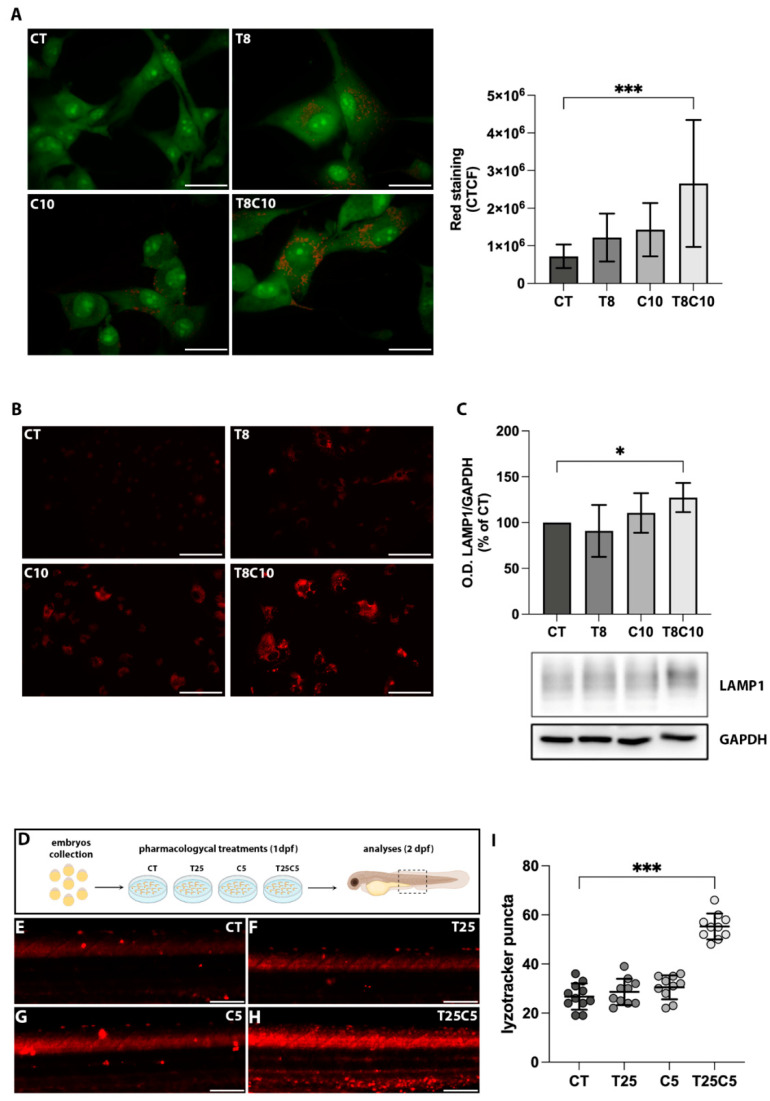
Figure 3
Combined HDAC6 and Hh inhibition altered acidic compartments. (A) U87-MG cells treated with vehicle (CT), 8 μM of TubA (T8), 10 μM of cyclo (C10), and 8 μM of TubA +10 μM cyclo (T8C10) for 48 h and stained with acridine orange. The AO accumulation into acidic compartments is represented by red dots. Green fluorescence arose from AO binding to DNA and RNA (B). Quantitative analysis of red fluorescence was calculated as corrected total cell fluorescence (CTCF) ± standard deviation. (C) LysoTracker Red staining in U87-MG cells treated with or without T8, C10, or T8C10. (D) Western blot analysis of LAMP1 protein expression normalized against GAPDH. Data are expressed as the percentage of the CT. (E) Schematic description of the pharmacological treatments in zebrafish. (F–I) Representative images of the trunk region of zebrafish embryos treated with 25 μM of TubA (T25) or 5 μM of cyclo (C5), alone or in combination, and stained with LysoTracker Red. (I) Quantification of the LysoTracker Red intensity in the trunk region of treated embryos. Scale bar indicates 40 μm (A) and 100 μm (B,E–H). Data are presented as mean ± standard deviation. CT—vehicle; TubA/T—tubastatin A; cyclo/C—cyclopamine. One-way ANOVA with Tukey post hoc correction. *** p < 0.001; * p < 0.05; nonsignificant data are not shown.