
Figure 4
- ID
- ZDB-FIG-230401-6
- Publication
- Pezzotta et al., 2023 - Combined Inhibition of Hedgehog and HDAC6: In Vitro and In Vivo Studies Reveal a New Role for Lysosomal Stress in Reducing Glioblastoma Cell Viability
- Other Figures
- All Figure Page
- Back to All Figure Page
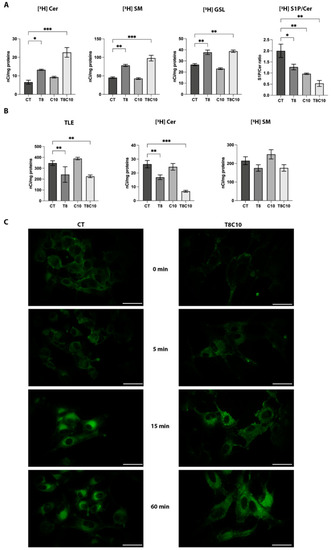
Sphingolipid metabolism and distribution were impaired following Hh and HDAC6 inhibition. (A) Radioactivity distribution among different sphingolipids after [1-3H]sphingosine administration at the metabolic steady state in U87-MG cells untreated (controls, CT) or treated with 8 μM of TubA (T8), 10 μM of cyclo (C10), and 8 μM of TubA + 10 μM cyclo (T8C10). Data are presented as mean of nCi/mg protein ± standard deviation. (B) Radioactivity of the total lipid extract (TLE), ceramide (Cer), and sphingomyelin (SM) following 2 h of [3H]SM administration in U87-MG cells CT or treated with T8, C10, or T8C10. Data are presented as mean of nCi/mg protein ± standard deviation. (C) Uptake and subcellular localization of fluorescent BODIPY-SM after treatment in U87-MG cells treated with or without T8C10 at 0 min, 5 min, 15 min, and 60 min. CT—vehicle; TubA/T—tubastatin A; cyclo/C—cyclopamine. One-way ANOVA with Tukey post hoc correction. *** p < 0.001; ** p < 0.01; * p < 0.05; nonsignificant data are not shown. Scale bar indicates 40 μm. |