
|
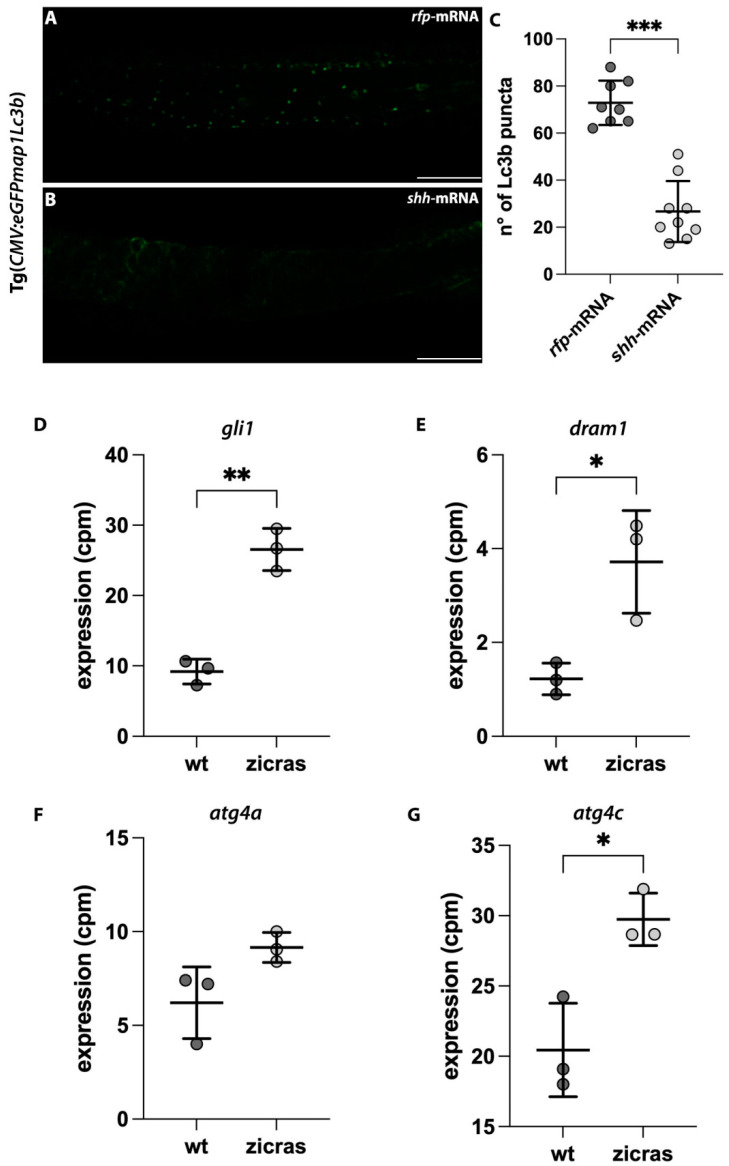
Figure 6
Impairment of the autophagic process in the zebrafish model with Hh hyper activation and in the zicras mutants. (A,B) Confocal images of the trunk-tail region of Tg(CMV:eGFPmap1Lc3b) embryos injected with (A) rfp-mRNA or (B) shh mRNA. (C) Count of the Lc3b puncta of rfp- and shh-mRNA injected embryos. Scale bar indicates 100 μm. (D–G) Expression analyses of (D) gli1 and genes involved in autophagy activation, including (E) dram1; (F) atg4a, and (G) atg4c, derived from the analyses of wild-type and zicras (tumor) zebrafish brains (GSE74754). Data are presented as mean ± standard deviation. cpm—counts per million. Unpaired t-test with Welch correction. *** p < 0.001; ** p < 0.01; * p < 0.05. Scale bar indicates 100 μm.