
|
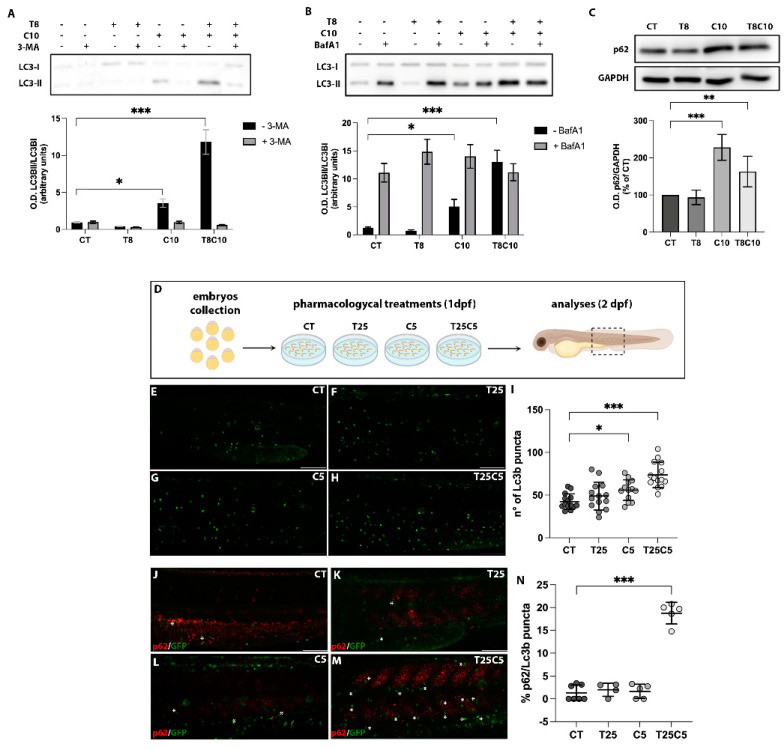
Figure 2
Autophagy was impaired following combination treatments with inhibitors of HDAC6 and Hh pathway in U87-MG cells and zebrafish embryos. (A,B) Western blot analysis and quantification of LC3 protein expression levels after treatments with 8 μM of TubA (T8), 10 μM of cyclo (C10), and 8 μM of TubA + 10 μM of cyclo (T8C10) in the presence (grey)/absence (black) of (A) 3-MA or (B) BafA1. (C) Western blot analysis and quantification of p62/SQSTM1 protein expression following 48 h treatments with or without T8 and C10, alone or in combination (T8C10). Data are expressed as the percentage of the control. (D) Schematic representation of the pharmacological treatments. (E–H) Confocal images of the trunk region of the Tg(CMV:eGFPmap1Lc3b) zebrafish embryos at 2 dpf after treatment with (E) DMSO, (F) 25 μM of TubA (T25), (G) 5 μM of cyclo (C5), and (H) 25 μM of TubA + 5 μM cyclo (T25C5). (I) Count of Lc3b puncta (green puncta) in the trunk region of treated embryos. (J–M) Confocal images of the trunk region of the Tg(CMV:eGFPmap1Lc3b) zebrafish embryos at 2 dpf stained with p62 antibody after treatment with (J) DMSO, (K) T25, (L) C5, and (M) T25C5. (N) Percentage of Lc3b/p62 puncta in the trunk region of treated embryos. Asterisks indicate the colocalization. Scale bar indicates 100 μm. CT—vehicle; TubA/T—tubastatin A; cyclo/C—cyclopamine. One-way ANOVA with Tukey post hoc test. Data are presented as mean ± standard deviation *** p < 0.001; ** p < 0.01; * p < 0.05.