
- Title
-
The link between glycemic control measures and eye microvascular complications in a clinical cohort of type 2 diabetes with microRNA-223-3p signature
- Authors
- Da'as, S.I., Ahmed, I., Hasan, W.H., Abdelrahman, D.A., Aliyev, E., Nisar, S., Bhat, A.A., Joglekar, M.V., Hardikar, A.A., Fakhro, K.A., Akil, A.S.A.
- Source
- Full text @ J Transl Med
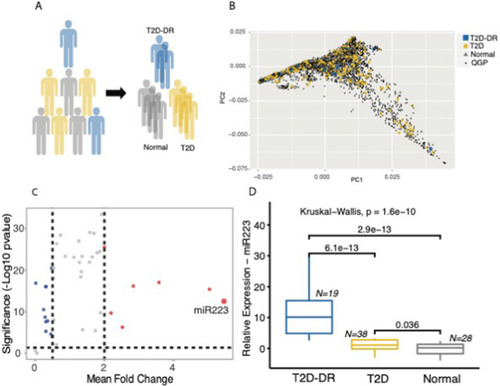
miR-223-3p is upregulated in individuals with type 2 diabetes and diabetic retinopathy. A A sub-cohort of individuals selected from the Qatar Genome Programme (QGP) participants were stratified into T2D patients and Normal controls based on self-reporting of a physician diagnosis for diabetes or HbA1c levels greater than 6.5%. T2D individuals with diabetic retinopathy (T2D-DR) were identified by examining the retinal images. B Principal component analysis based on biallelic germline variants presents the distribution of case- and control-study samples across the nationwide QGP population with no selection bias in the representative sample. C mi-R223 was identified as the top-upregulated miRNA in our target panel with elevated expression in T2D. D Amongst T2D individuals, miR-223-3p expression was significantly higher in plasma from individuals with DR (T2D-DR) compared to Controls and T2D individuals without DR. Boxplots show the distribution of relative expression for miR-223-3p across all study samples |
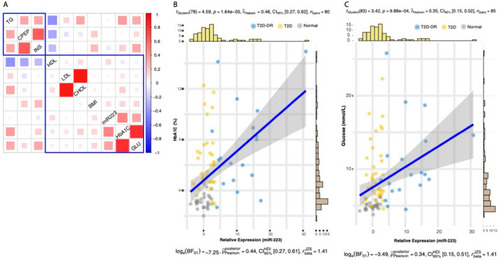
Association of miR-223-3p expression with clinical characteristics of diabetes. A Heatmap of the hierarchically clustered Pearson correlation coefficients. The rectangles demarcate two major clusters of trait associations as identified through hierarchical clustering method. Mi-R223 expression was observed to significantly correlate with B plasma HbA1C and C glucose levels. The statistics for the Pearson’s correlation test are shown at the top of each scatterplot, and the Bayes Factor analysis is shown at the bottom. The scatterplots and their associated statics were calculated through ggstatsplot package [45] in R. TG triglycerides, CPEP C-peptide, INS insulin, HDL high-density lipoprotein, LDL low-density lipoprotein, CHOL total cholesterol, BMI body mass index, miR-223-3p microRNA miR-223-3p, HbA1c hemoglobin A1c, GLU glucose |
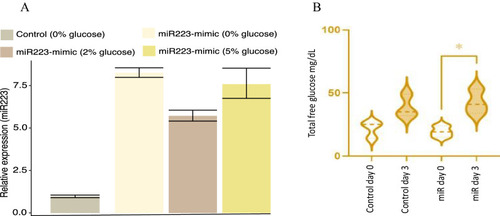
Functional validation of miR-223-3p in a hyperglycemic zebrafish model. A Fold change increase in miR-223-3p mimic in various glucose concentrations compared to control group at 0% glucose. B Overexpression of miR-223-3p resulted in a significant increase in total glucose concentrations in zebrafish. The expression of miR-223-3p resulted in a significant increase in total glucose levels when measured at 3 days old (day 3) compared to the baseline glucose levels at 3 h post-fertilization (3hpf, day 0), n = 75 larvae per group. Data represent n = 3 separate experiments and are presented with a mean (dashed lines) and quartiles (dotted lines) for the distribution observed. Total glucose levels were measured using Accu-Check Performa Nano. Statistical analysis was conducted using t-test Graph Pad version 9.0 |
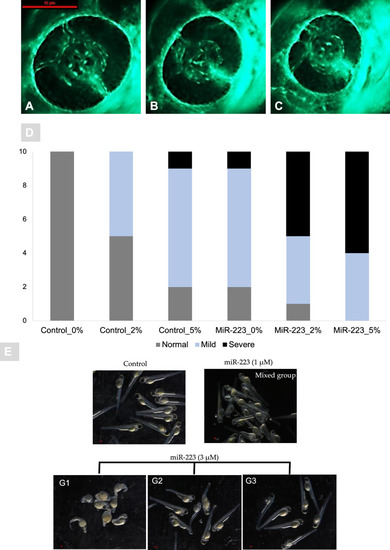
miR-223-3p resulted in aberrant eye vasculature sprout formation. Normal zebrafish eye vasculature development is characterized by three clearly branched blood vessels (indicated by white arrowheads). Exposure to miR-223-3p mimic restricted the growth of these three vessels. The examined groups were scored as three subclasses: normal, mildly affected, and severely affected. A–C Representative images of Tg (fli1a:roy,mitf:GFP) with vasculature expressing green fluorescent protein; A normal, B mild, C severe. The blood vessels displayed abnormal sprouting in mildly and severely affected eyes. Both miR-223-3p (MiR0%G, MiR 2%G, MiR 5%G) and hyperglycemia conditions (control 2%G, control 5%G) resulted in a significant alteration to the developing of blood vessels compared to control with no glucose incubation (control 0%G). Images were obtained using Lumar 12 stereomicroscope (Zeiss Microscopy) and a Nikon camera at ×100 magnification; scale bar, 10 µm. A total number of larvae measured was n = 10 per group. Statistical analysis was conducted using chi-square. D Bar plots showing the distribution of normal, mild, and severe phenotypes in control and miR-223-3p groups in different hyperglycemic conditions (0% G, 2% G, 5% G). E Representative images of injected miR-223-3p embryos into the one-cell stage, with different dose titration levels (1, and 3 μM) in the absence of glucose. The embryos at three days post fertilization were presented with severe developmental defects with 3 μM titration and were classified into 3 groups (G1, G2, and G3) depending on the severity and percentages of abnormally developed larvae. Compared to the control group, the larvae in 1 μM appeared with mixed effects that were less prominent than 3 μM groups. Representative Images were captured using Lumar V.12 stereomicroscope and Nikon camera at ×25 |
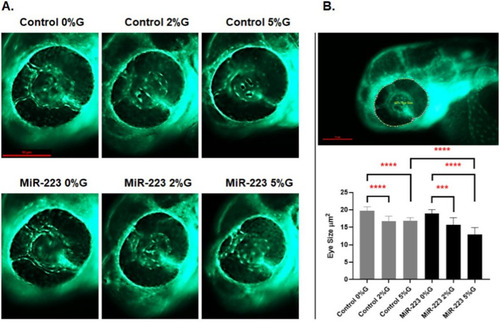
miR-223-3p association with zebrafish eye defects. A the different groups were imaged at ×150 magnification, and the eye images were traced using danioscope software (Noldus Technologies, Netherlands) for eye size measurement. Images were obtained using Lumar 12 stereomicroscope (Zeiss Microscopy) and a Nikon camera at ×100 magnification; scale bar, 10 mm. B incubation of the different groups in glucose affected the development of the eyes, as demonstrated by aberrant vasculature nourishment that led to a significant reduction in eye size. The different groups incubated in 2% and 5% glucose showed significantly reduced eye size on day 3. The miR-223-3p mimic had severely impaired eye morphology compared to the controls in the 5% glucose condition. Total number of larvae measured was n = 10 per group. Statistical analysis was conducted using ANOVA Graph Pad version 9.0 |
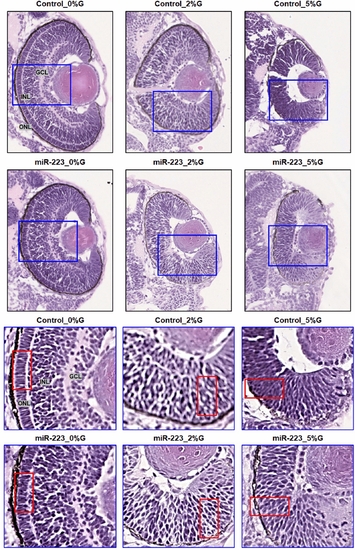
miR-223-3p association with abnormalities in the zebrafish eye. Histological examination was performed on coronal sections of whole zebrafish larvae that were stained with hematoxylin and eosin. Both miR-223-3p mimic and hyperglycemia conditions displayed abnormal eye morphology and eye cellular components, including the ganglion cell layer (GGL), inner nuclear layer (INL), and outer nuclear layer (ONL). The MiR-223-3p overexpression resulted in sparse cellular arrangements within the eye compared to matched glucose condition. All other groups demonstrated severe abnormalities in the cellular components of the eye. Images were obtained using a Philips slide scanner at ×40 magnification |
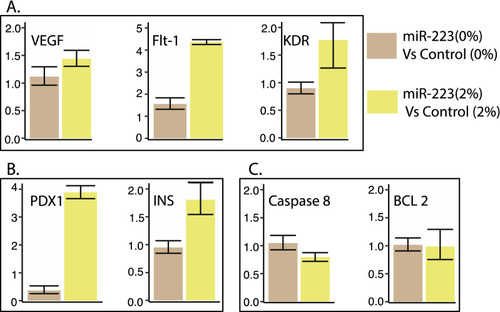
miR-223-3p mimic effects in zebrafish model. A Effects of miR-223-3p on mRNA expression of three angiogenic markers (VEGFA, FLT-1, KDR) in zebrafish embryos. The expression levels were normalized to EF1A with bars representing average relative expression from replicates and whiskers indicating standard errors of mean. The overexpression of miR-223-3p mimic (miR-223-3p) at 0% and 2% glucose conditions compared to the control group (Control). The increased levels of miR-223-3p resulted in a fold-change increase in the three angiogenic markers compared to matching control groups. B Effects of miR-223-3p on mRNA expression of two pancreatic markers (PDX1, required for the pancreas and beta-cell development) and (INS, regulator of blood glucose levels by insulin-secreting beta-cells) in zebrafish embryos. For both, the expression levels were normalized to EF1A. In the presence of 2% glucose, adding miR-223-3p resulted in a fold-change increase in the two pancreatic markers compared to the matching control group. C Effects of miR-223-3p on mRNA expression of two apoptosis markers (CASP 8 and BCL 2) in zebrafish embryos. For both markers, the expression levels were normalized to EF1A. The increased levels of miR-223-3p in the absence (0%) and the presence of 2% glucose showed comparable expression of the two markers compared to the matched control groups |
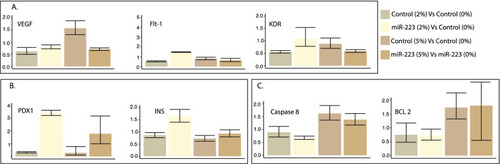
Hyperglycemic effects in zebrafish models. A The hyperglycemia conditions (2% and 5% glucose) altered angiogenic marker expression levels. Increased levels of miR-223-3p were associated with increased expression of VEGF receptors (FTL-1 and KDR) at 2% glucose condition compared to the control group. The Control group at 5% glucose condition showed increased VEGF expression levels. B The hyperglycemia conditions were associated with the upregulation of pancreatic markers within the mimic miR-223-3p group. C The control group showed increased expression levels of apoptotic markers at 5% glucose. Expression was analyzed as described in Fig. 7 |