
Fig. 7
- ID
- ZDB-FIG-230306-36
- Publication
- Da'as et al., 2023 - The link between glycemic control measures and eye microvascular complications in a clinical cohort of type 2 diabetes with microRNA-223-3p signature
- Other Figures
- All Figure Page
- Back to All Figure Page
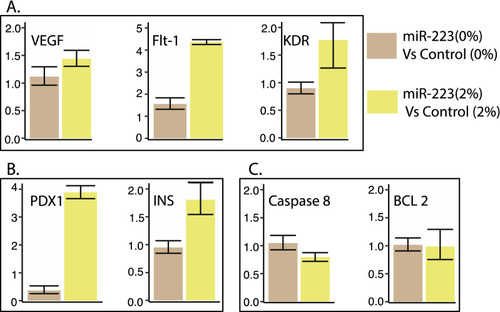
miR-223-3p mimic effects in zebrafish model. A Effects of miR-223-3p on mRNA expression of three angiogenic markers (VEGFA, FLT-1, KDR) in zebrafish embryos. The expression levels were normalized to EF1A with bars representing average relative expression from replicates and whiskers indicating standard errors of mean. The overexpression of miR-223-3p mimic (miR-223-3p) at 0% and 2% glucose conditions compared to the control group (Control). The increased levels of miR-223-3p resulted in a fold-change increase in the three angiogenic markers compared to matching control groups. B Effects of miR-223-3p on mRNA expression of two pancreatic markers (PDX1, required for the pancreas and beta-cell development) and (INS, regulator of blood glucose levels by insulin-secreting beta-cells) in zebrafish embryos. For both, the expression levels were normalized to EF1A. In the presence of 2% glucose, adding miR-223-3p resulted in a fold-change increase in the two pancreatic markers compared to the matching control group. C Effects of miR-223-3p on mRNA expression of two apoptosis markers (CASP 8 and BCL 2) in zebrafish embryos. For both markers, the expression levels were normalized to EF1A. The increased levels of miR-223-3p in the absence (0%) and the presence of 2% glucose showed comparable expression of the two markers compared to the matched control groups |