
Fig. 3
- ID
- ZDB-FIG-230306-32
- Publication
- Da'as et al., 2023 - The link between glycemic control measures and eye microvascular complications in a clinical cohort of type 2 diabetes with microRNA-223-3p signature
- Other Figures
- All Figure Page
- Back to All Figure Page
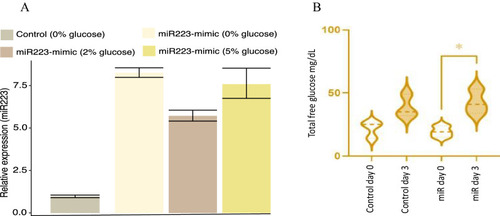
Functional validation of miR-223-3p in a hyperglycemic zebrafish model. A Fold change increase in miR-223-3p mimic in various glucose concentrations compared to control group at 0% glucose. B Overexpression of miR-223-3p resulted in a significant increase in total glucose concentrations in zebrafish. The expression of miR-223-3p resulted in a significant increase in total glucose levels when measured at 3 days old (day 3) compared to the baseline glucose levels at 3 h post-fertilization (3hpf, day 0), n = 75 larvae per group. Data represent n = 3 separate experiments and are presented with a mean (dashed lines) and quartiles (dotted lines) for the distribution observed. Total glucose levels were measured using Accu-Check Performa Nano. Statistical analysis was conducted using t-test Graph Pad version 9.0 |