
Fig. 2
- ID
- ZDB-FIG-230306-31
- Publication
- Da'as et al., 2023 - The link between glycemic control measures and eye microvascular complications in a clinical cohort of type 2 diabetes with microRNA-223-3p signature
- Other Figures
- All Figure Page
- Back to All Figure Page
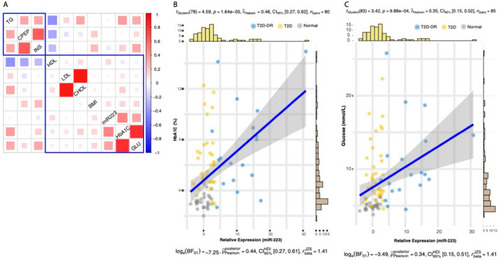
Association of miR-223-3p expression with clinical characteristics of diabetes. A Heatmap of the hierarchically clustered Pearson correlation coefficients. The rectangles demarcate two major clusters of trait associations as identified through hierarchical clustering method. Mi-R223 expression was observed to significantly correlate with B plasma HbA1C and C glucose levels. The statistics for the Pearson’s correlation test are shown at the top of each scatterplot, and the Bayes Factor analysis is shown at the bottom. The scatterplots and their associated statics were calculated through ggstatsplot package [45] in R. TG triglycerides, CPEP C-peptide, INS insulin, HDL high-density lipoprotein, LDL low-density lipoprotein, CHOL total cholesterol, BMI body mass index, miR-223-3p microRNA miR-223-3p, HbA1c hemoglobin A1c, GLU glucose |