
- Title
-
Rgp1 contributes to craniofacial cartilage development and Rab8a-mediated collagen II secretion
- Authors
- Ritter, D.J., Choudhary, D., Unlu, G., Knapik, E.W.
- Source
- Full text @ Front Endocrinol (Lausanne)
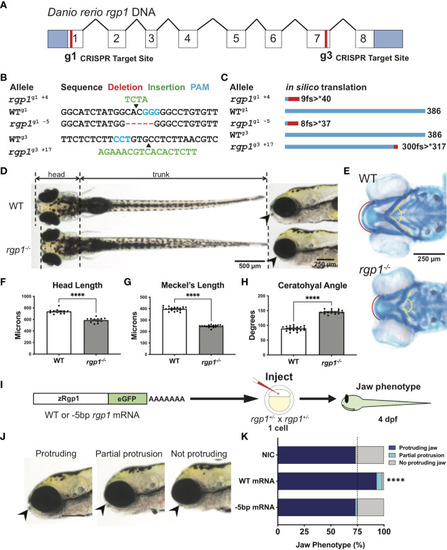
Rgp1 is required for zebrafish craniofacial skeletal development. (A) Zebrafish rgp1 intron/exon map showing locations of g1 and g3 gRNA target sites. (B) Sequences from three different alleles isolated from the use of g1 and g3 gRNAs. (C) Predicted peptide lengths for alleles shown in (B). (D) Live imaging of 5 dpf WT and rgp1-/- larvae from ventral and lateral view showing jaw protrusions (black arrowhead). (E) Alcian blue staining and imaging of 5 dpf WT and rgp1-/- cartilage in the ventral craniofacial head skeleton. The Meckel’s cartilage (red), and ceratohyal (yellow, dashed) are marked. (F) Quantification of larva head length. (G) Quantification of Meckel’s cartilage length. (H) Quantification of ceratohyal cartilage angle. (I) Schematic for zebrafish rgp1 mRNA injection and rescue experiment. (J) Lateral images of larvae showing jaw protrusion, partial protrusion, and no protrusion phenotypes (black arrowheads). (K) Quantification of jaw phenotype percentages in groups of injected and non-injected embryos. Significance is presented by ****p<0.0001. PHENOTYPE:
|
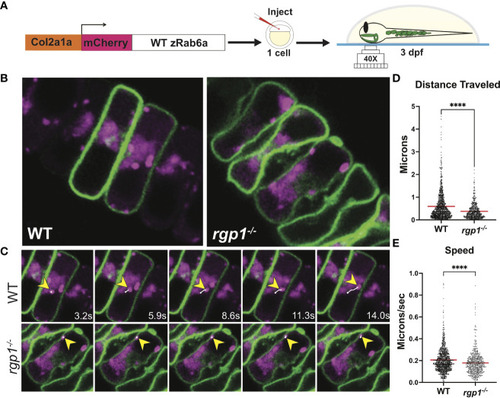
Rab6a vesicle trafficking is reduced in rgp1-/- chondrocytes (A) Experimental design for mosaic overexpression of WT mCherry-zRab6a fusion protein in Tg(Col2a1α:caax-eGFP) transgenic zebrafish chondrocytes for live imaging. (B) Representative images from movies of mCherry-zRab6a vesicular compartment movement in chondrocytes ( Supplemental Movies 1, 2). (C) Montage of mCherry-zRab6a puncta progression at specific times in WT and rgp1-/- chondrocytes (yellow arrowheads) showing path of indicated vesicle over time (white line). (D) Quantification of vesicular compartment distances traveled in WT and rgp1-/- chondrocytes. Red lines indicate means. (E) Quantification of vesicular compartment speeds in WT and rgp1-/- chondrocytes. Red lines indicate means. Significance is presented by ****p<0.0001. |
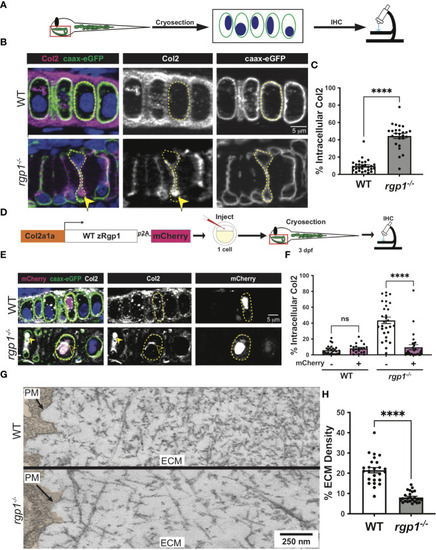
Rgp1-/- chondrocytes accumulate collagen II intracellularly. (A) Experimental design for immunohistochemical analysis of chondrocytes in the craniofacial head skeleton. (B) Representative images of Tg(Col2a1α:caax-eGFP) transgenic larvae in WT and rgp1-/- cartilage (Col2, magenta; eGFP, green). Yellow arrowhead identifies intracellular collagen II. (C) Quantification of the percentage of cytosolic area occupied by collagen II signal in chondrocytes. (D) Experimental design for mosaic overexpression of zRgp1-p2A-mCherry in zebrafish chondrocytes. (E) Representative images of Tg(Col2a1α:caax-eGFP) transgenic chondrocytes in WT and rgp1-/- cartilage (TEM images of chondrocyte membranes (PM) and adjacent mCherry, magenta; eGFP, green; Col2, white). Yellow arrowhead identifies collagen II in mCherry- cells while empty arrowhead identifies collagen II in mCherry+ cells. (F) Quantification of the percentage of cytosolic area occupied by collagen II signal in chondrocytes. (G) TEM images of chondrocyte membranes and adjacent ECM proteins. (H) Quantification of TEM staining density from craniofacial chondrocyte plasma membrane to edge of cartilage tissue using ImageJ. Significance is presented by ****p<0.0001; ns, not signficant. EXPRESSION / LABELING:
PHENOTYPE:
|
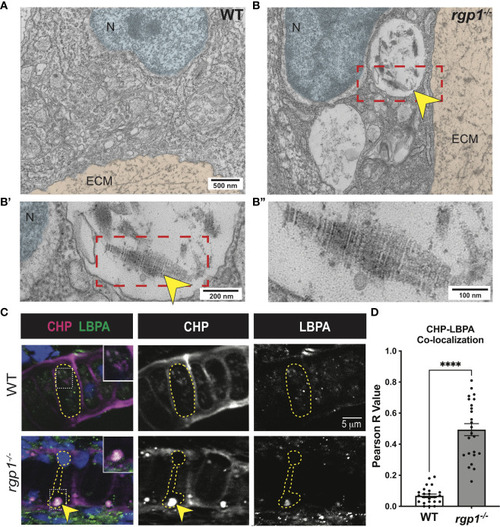
Collagen II accumulations in rgp1-/- chondrocytes localize to endolysosomes (A) TEM images of 3 dpf WT craniofacial chondrocytes. (B) TEM images of 3 dpf rgp1-/- craniofacial chondrocytes showing vacuolar structures (yellow arrowhead) (B’) Enlarged image of boxed area showing striated ultrastructure of intracellular collagen fibrils (yellow arrowhead). (B”) Further enlargement of boxed area. (C) Representative images of chondrocytes in WT and rgp1-/- cartilage (CHP, magenta; LBPA, green). Insets are enlargements of white dashed boxes, and an intracellular accumulation is labeled with a yellow arrowhead. (D) Quantification of the Pearson R value for co-localization in individual chondrocytes. Significance is presented by ****p<0.0001. PHENOTYPE:
|
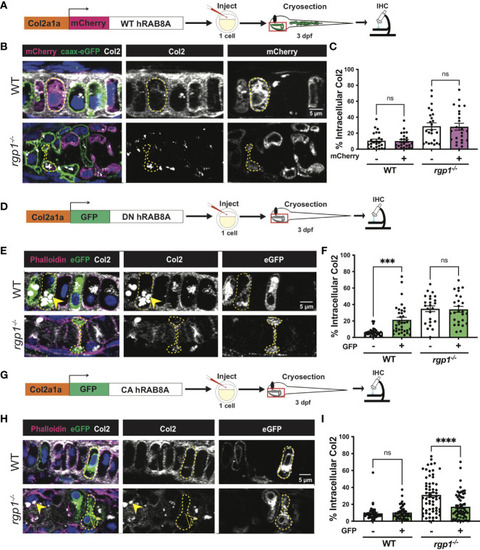
Collagen II trafficking is regulated by Rab8a. (A) Experimental design for mosaic overexpression of WT mCherry-hRAB8A fusion protein in zebrafish chondrocytes. (B) Representative images of Tg(Col2a1α:caax-eGFP) transgenic chondrocytes in WT and rgp1-/- cartilage (mCherry, magenta; caax-eGFP, green; Col2, white). (C) Quantification of the percentage of cytosolic area occupied by collagen II signal in chondrocytes. (D) Experimental design for mosaic overexpression of DN GFP-hRAB8A fusion protein in zebrafish chondrocytes. (E) Representative images of chondrocytes in WT and rgp1-/- cartilage (phalloidin, magenta; eGFP, green; Col2, white). Yellow arrowhead identifies intracellular collagen II. (F) Quantification of the percentage of cytosolic area occupied by collagen II signal in chondrocytes. (G) Experimental design for mosaic overexpression of CA GFP-hRAB8A fusion protein in zebrafish chondrocytes. (H) Representative images of chondrocytes in WT and rgp1-/- cartilage (phalloidin, magenta; eGFP, green; Col2, white). Yellow arrowhead identifies collagen II in GFP- cells while empty arrowhead identifies collagen II in GFP+ cells. (I) Quantification of the percentage of cytosolic area occupied by collagen II signal in chondrocytes. Significance is presented by ***p<0.001; ****p<0.0001; ns, not signficant. |
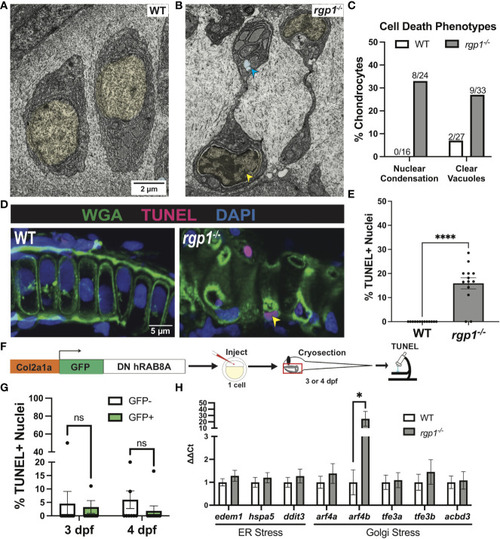
rgp1-/- chondrocytes undergo cell death and induce a Golgi stress marker. (A) TEM images of 3 dpf WT chondrocytes showing normal cellular morphology. (B) rgp1-/- craniofacial chondrocytes showing partial nuclear condensation (yellow shading, blue arrow) and clear cytoplasmic vacuoles (blue shading, blue arrow). (C) Quantification of cell death-associated TEM phenotypes. (D) Representative images of chondrocytes labeled with TUNEL and WGA in WT and rgp1-/- cartilage (TUNEL, magenta; WGA, green). Yellow arrowhead identifies TUNEL+ nucleus. (E) Quantification of the percentage of nuclei that were TUNEL+ in each image. (F) Experimental design for mosaic overexpression of DN GFP-hRAB8A fusion protein in zebrafish chondrocytes, as used in Figure 5A . (G) Quantification of the percentage of nuclei that were TUNEL+ in each image at 3 dpf or 4 dpf (H) qPCR panel of ER stress transcripts (edem1, bip, chop) and Golgi stress transcripts (arf4a, arf4b, tfe3a, tfe3b, acbd3) normalized to ef-1 transcript levels in 3 dpf larvae. Significance is presented by *p<0.05; ****p<0.0001; ns, not signficant. EXPRESSION / LABELING:
PHENOTYPE:
|