
Figure 6
|
Figure 6
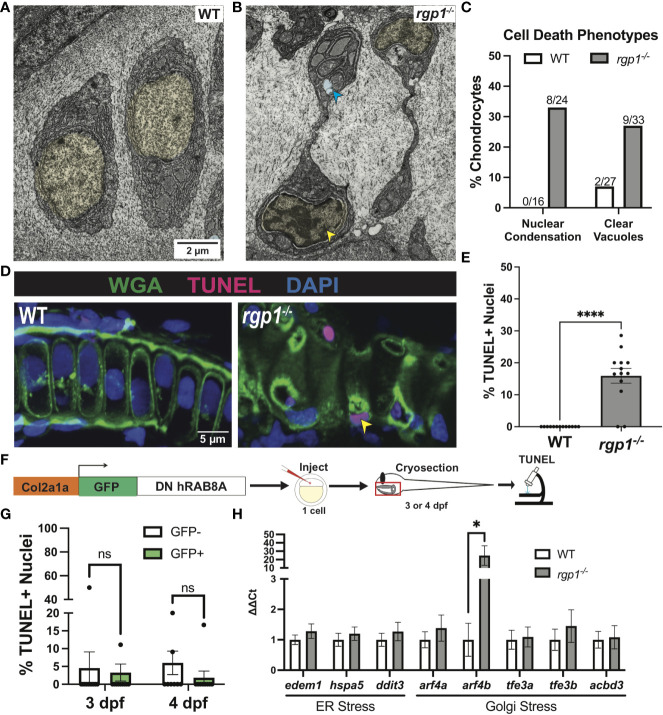
rgp1-/- chondrocytes undergo cell death and induce a Golgi stress marker. (A) TEM images of 3 dpf WT chondrocytes showing normal cellular morphology. (B) rgp1-/- craniofacial chondrocytes showing partial nuclear condensation (yellow shading, blue arrow) and clear cytoplasmic vacuoles (blue shading, blue arrow). (C) Quantification of cell death-associated TEM phenotypes. (D) Representative images of chondrocytes labeled with TUNEL and WGA in WT and rgp1-/- cartilage (TUNEL, magenta; WGA, green). Yellow arrowhead identifies TUNEL+ nucleus. (E) Quantification of the percentage of nuclei that were TUNEL+ in each image. (F) Experimental design for mosaic overexpression of DN GFP-hRAB8A fusion protein in zebrafish chondrocytes, as used in Figure 5A . (G) Quantification of the percentage of nuclei that were TUNEL+ in each image at 3 dpf or 4 dpf (H) qPCR panel of ER stress transcripts (edem1, bip, chop) and Golgi stress transcripts (arf4a, arf4b, tfe3a, tfe3b, acbd3) normalized to ef-1 transcript levels in 3 dpf larvae. Significance is presented by *p<0.05; ****p<0.0001; ns, not signficant.