
|
Figure 5
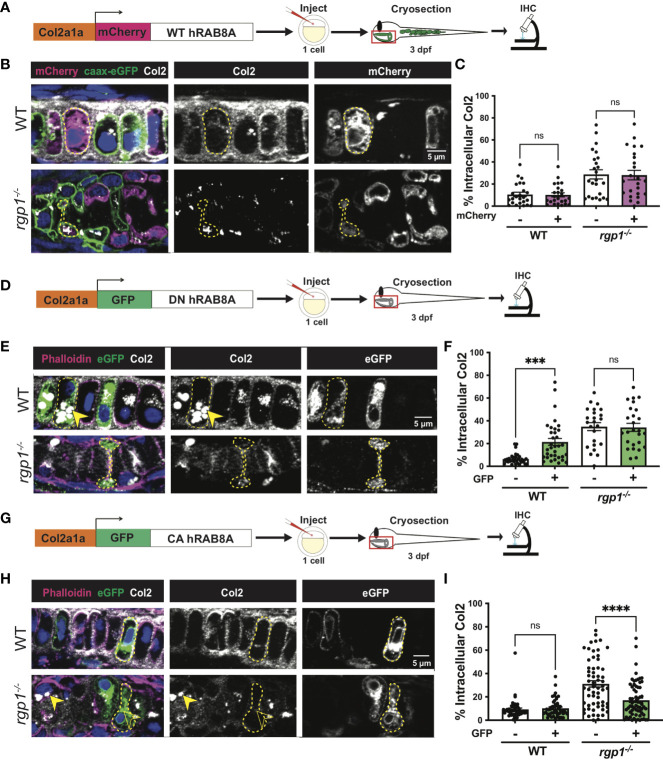
Collagen II trafficking is regulated by Rab8a. (A) Experimental design for mosaic overexpression of WT mCherry-hRAB8A fusion protein in zebrafish chondrocytes. (B) Representative images of Tg(Col2a1α:caax-eGFP) transgenic chondrocytes in WT and rgp1-/- cartilage (mCherry, magenta; caax-eGFP, green; Col2, white). (C) Quantification of the percentage of cytosolic area occupied by collagen II signal in chondrocytes. (D) Experimental design for mosaic overexpression of DN GFP-hRAB8A fusion protein in zebrafish chondrocytes. (E) Representative images of chondrocytes in WT and rgp1-/- cartilage (phalloidin, magenta; eGFP, green; Col2, white). Yellow arrowhead identifies intracellular collagen II. (F) Quantification of the percentage of cytosolic area occupied by collagen II signal in chondrocytes. (G) Experimental design for mosaic overexpression of CA GFP-hRAB8A fusion protein in zebrafish chondrocytes. (H) Representative images of chondrocytes in WT and rgp1-/- cartilage (phalloidin, magenta; eGFP, green; Col2, white). Yellow arrowhead identifies collagen II in GFP- cells while empty arrowhead identifies collagen II in GFP+ cells. (I) Quantification of the percentage of cytosolic area occupied by collagen II signal in chondrocytes. Significance is presented by ***p<0.001; ****p<0.0001; ns, not signficant.